i3.2xlarge by Amazon Web Services
Geekbench is a cross-platform processor benchmark with a scoring system that determines single-core and multi-core performance using loads simulating real-world scenarios. Geekbench 5 score is calculated with a reference score of 2500 representing the performance of the Intel Core i5-2520M @ 2.50 GHz. The software benchmark is available for Mac OS, Windows, Linux, Android and iOS platforms.
Specifications:
CPU
8
RAM
61.0 GB
Extra
1x
1900 GB
NVMe SSD
Net
10000 Mbps
{
"configuration": {
"chart": {
"type": "scatter",
"polar": false,
"zoomType": "",
"options3d": {},
"height": null,
"width": null,
"margin": null,
"inverted": false,
"zooming": {}
},
"credits": {
"enabled": false
},
"title": {
"text": ""
},
"colorAxis": null,
"subtitle": {
"text": ""
},
"xAxis": {
"title": {
"text": [
"Single Score"
],
"useHTML": false,
"style": {
"color": "#666666"
}
},
"categories": null,
"lineWidth": 1,
"tickInterval": null,
"tickWidth": 1,
"tickLength": 10,
"tickPixelInterval": 100,
"plotLines": null,
"labels": {
"enabled": true,
"format": null,
"formatter": "",
"style": {
"color": "#666666",
"cursor": "default",
"fontSize": "11px"
},
"useHTML": false,
"step": 0
},
"plotBands": null,
"visible": true,
"floor": null,
"ceiling": null,
"type": "linear",
"min": 0,
"gridLineWidth": 1,
"gridLineColor": "#e6e6e6",
"minorTickInterval": null,
"minorTickWidth": 0,
"minTickInterval": null,
"startOnTick": true,
"endOnTick": true,
"tickmarkPlacement": 100,
"units": 100,
"minRange": 100
},
"yAxis": {
"title": {
"text": [
"Multi Score"
],
"useHTML": false,
"style": {
"color": "#666666"
}
},
"categories": null,
"plotLines": null,
"plotBands": null,
"lineWidth": null,
"tickInterval": null,
"tickLength": 10,
"floor": null,
"ceiling": null,
"gridLineInterpolation": null,
"gridLineWidth": 1,
"gridLineColor": "#e6e6e6",
"min": 0,
"max": null,
"minorTickInterval": null,
"minorTickWidth": 0,
"minTickInterval": null,
"startOnTick": true,
"endOnTick": true,
"minRange": null,
"type": "linear",
"tickmarkPlacement": null,
"labels": {
"enabled": true,
"formatter": null,
"style": {
"color": "#666666",
"cursor": "default",
"fontSize": "11px"
},
"useHTML": false
}
},
"zAxis": {
"title": {
"text": "Multi Score"
}
},
"plotOptions": {
"series": {
"dataLabels": {
"enabled": false,
"format": null,
"distance": 30,
"align": "center",
"inside": null,
"allowOverlap": false,
"style": {
"fontSize": "11px"
}
},
"showInLegend": null,
"turboThreshold": 0,
"stacking": "",
"groupPadding": 0.2,
"centerInCategory": false,
"findNearestPointBy": "x"
}
},
"navigator": {
"enabled": false
},
"scrollbar": {
"enabled": false
},
"rangeSelector": {
"enabled": false,
"inputEnabled": false
},
"legend": {
"enabled": null,
"maxHeight": null,
"align": "center",
"verticalAlign": "bottom",
"layout": "horizontal",
"width": null,
"margin": 12,
"reversed": false
},
"series": [
{
"name": "i3.2xlarge by Amazon Web Services",
"color": "#f7981d",
"data": [
{
"x": 716.2126810664423,
"y": 3251.092029360201
},
{
"x": 716.4701313444848,
"y": 3257.972538252107
},
{
"x": 711.9004442153923,
"y": 3268.845513949898
},
{
"x": 716.9612249419644,
"y": 3254.660880257955
},
{
"x": 715.6019526198602,
"y": 3262.8494568174956
},
{
"x": 714.6617598414779,
"y": 3252.9431934786444
},
{
"x": 723.552478777127,
"y": 3266.793600268129
},
{
"x": 726.7473095291534,
"y": 3265.950869423694
},
{
"x": 720.2901856694011,
"y": 3269.5461231215195
},
{
"x": 713.9662148496623,
"y": 3261.6588425056298
},
{
"x": 718.1835741908338,
"y": 3262.0043765460014
},
{
"x": 721.0653809200661,
"y": 3262.409590425083
},
{
"x": 716.3479961036531,
"y": 3262.532321423933
},
{
"x": 715.0437429456815,
"y": 3265.3234671172054
},
{
"x": 715.8998874918962,
"y": 3264.189317920461
},
{
"x": 714.8755874420751,
"y": 3260.0509526258384
},
{
"x": 716.1409504739536,
"y": 3261.0825101575047
},
{
"x": 725.9301213827271,
"y": 3259.426762435054
},
{
"x": 723.1156404782796,
"y": 3258.3506897685684
},
{
"x": 716.2466099890567,
"y": 3262.7737173608657
},
{
"x": 713.3057428844032,
"y": 3268.843019547119
},
{
"x": 723.9835803693584,
"y": 3256.9521233743185
},
{
"x": 707.8501055485357,
"y": 3267.547319220508
},
{
"x": 716.558433998556,
"y": 3265.0639310118095
},
{
"x": 720.6864601527327,
"y": 3267.276111186587
},
{
"x": 727.6548737852717,
"y": 3293.382479833018
},
{
"x": 685.8726709365535,
"y": 3086.498907377764
},
{
"x": 729.9214817071211,
"y": 3294.724660167296
},
{
"x": 670.5252858191448,
"y": 3081.8925754773195
},
{
"x": 730.3724873218998,
"y": 3291.5359902845903
},
{
"x": 670.7199330435319,
"y": 3080.7006343565304
},
{
"x": 720.825869326833,
"y": 3293.3950764992546
},
{
"x": 672.2944591579977,
"y": 3079.8660951119296
},
{
"x": 732.4918108593503,
"y": 3293.310399948064
},
{
"x": 668.6138233909651,
"y": 3072.638219919486
},
{
"x": 730.8965137065425,
"y": 3292.931917754451
},
{
"x": 682.8353927716269,
"y": 3078.417409521956
},
{
"x": 719.9550674263684,
"y": 3297.9973389370402
},
{
"x": 686.0207316649028,
"y": 3086.943200597664
},
{
"x": 717.8640273759027,
"y": 3296.9186728783734
},
{
"x": 684.4268794797564,
"y": 3091.955902871733
},
{
"x": 719.8816467391036,
"y": 3292.657391310958
},
{
"x": 688.2638273289251,
"y": 3100.820422079995
},
{
"x": 714.5645420823956,
"y": 3292.5877709729584
},
{
"x": 681.6362273391001,
"y": 3087.4136453750198
}
]
}
],
"drilldown": {},
"tooltip": {
"enabled": true,
"useHTML": false,
"format": null,
"headerFormat": "",
"pointFormat": "<span style=\"color:{series.color}\">Single</span>: <b>{point.x:.0f}</b><br><span style=\"color:{series.color}\">Multi</span>: <b>{point.y:.0f}</b>",
"footerFormat": "",
"shared": false,
"outside": false,
"valueDecimals": null,
"split": false
},
"annotations": null
},
"hc_type": "chart",
"id": "308452381009417223957517464738614629689"
}
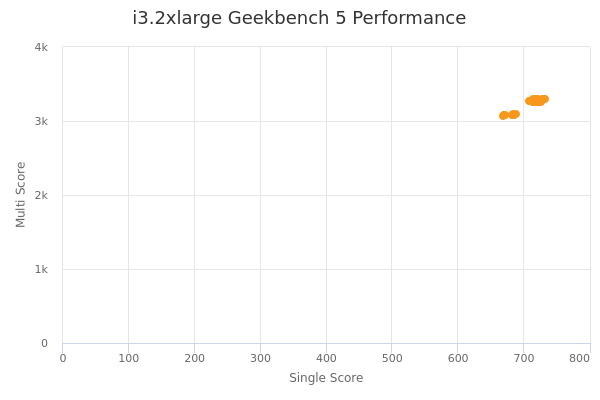
| Single | Multi | |
|---|---|---|
| Max | 732 | 3298 |
| Average | 711 | 3230 |
| Deviation | 17.93 | 78.76 |
| Min | 669 | 3073 |
Sign up as Freemium to get more insight.
- In same series
- i3.large
- i3.xlarge
- i3.2xlarge
- i3.4xlarge
- i3.8xlarge
- i3.16xlarge
- i3.metal