HICPU-8xCPU-16GB by UpCloud
Geekbench is a cross-platform processor benchmark with a scoring system that determines single-core and multi-core performance using loads simulating real-world scenarios. Geekbench 5 score is calculated with a reference score of 2500 representing the performance of the Intel Core i5-2520M @ 2.50 GHz. The software benchmark is available for Mac OS, Windows, Linux, Android and iOS platforms.
Specifications:
CPU
8
RAM
16.0 GB
Root
200 GB
Root HICPU-8xCPU-16GB MaxIOPS
{
"configuration": {
"chart": {
"type": "scatter",
"polar": false,
"zoomType": "",
"options3d": {},
"height": null,
"width": null,
"margin": null,
"inverted": false,
"zooming": {}
},
"credits": {
"enabled": false
},
"title": {
"text": ""
},
"colorAxis": null,
"subtitle": {
"text": ""
},
"xAxis": {
"title": {
"text": [
"Single Score"
],
"useHTML": false,
"style": {
"color": "#666666"
}
},
"categories": null,
"lineWidth": 1,
"tickInterval": null,
"tickWidth": 1,
"tickLength": 10,
"tickPixelInterval": 100,
"plotLines": null,
"labels": {
"enabled": true,
"format": null,
"formatter": "",
"style": {
"color": "#666666",
"cursor": "default",
"fontSize": "11px"
},
"useHTML": false,
"step": 0
},
"plotBands": null,
"visible": true,
"floor": null,
"ceiling": null,
"type": "linear",
"min": 0,
"gridLineWidth": 1,
"gridLineColor": "#e6e6e6",
"minorTickInterval": null,
"minorTickWidth": 0,
"minTickInterval": null,
"startOnTick": true,
"endOnTick": true,
"tickmarkPlacement": 100,
"units": 100,
"minRange": 100
},
"yAxis": {
"title": {
"text": [
"Multi Score"
],
"useHTML": false,
"style": {
"color": "#666666"
}
},
"categories": null,
"plotLines": null,
"plotBands": null,
"lineWidth": null,
"tickInterval": null,
"tickLength": 10,
"floor": null,
"ceiling": null,
"gridLineInterpolation": null,
"gridLineWidth": 1,
"gridLineColor": "#e6e6e6",
"min": 0,
"max": null,
"minorTickInterval": null,
"minorTickWidth": 0,
"minTickInterval": null,
"startOnTick": true,
"endOnTick": true,
"minRange": null,
"type": "linear",
"tickmarkPlacement": null,
"labels": {
"enabled": true,
"formatter": null,
"style": {
"color": "#666666",
"cursor": "default",
"fontSize": "11px"
},
"useHTML": false
}
},
"zAxis": {
"title": {
"text": "Multi Score"
}
},
"plotOptions": {
"series": {
"dataLabels": {
"enabled": false,
"format": null,
"distance": 30,
"align": "center",
"inside": null,
"allowOverlap": false,
"style": {
"fontSize": "11px"
}
},
"showInLegend": null,
"turboThreshold": 0,
"stacking": "",
"groupPadding": 0.2,
"centerInCategory": false,
"findNearestPointBy": "x"
}
},
"navigator": {
"enabled": false
},
"scrollbar": {
"enabled": false
},
"rangeSelector": {
"enabled": false,
"inputEnabled": false
},
"legend": {
"enabled": null,
"maxHeight": null,
"align": "center",
"verticalAlign": "bottom",
"layout": "horizontal",
"width": null,
"margin": 12,
"reversed": false
},
"series": [
{
"name": "HICPU-8xCPU-16GB by UpCloud",
"color": "#8b00ff",
"data": [
{
"x": 853.0679672971013,
"y": 5484.574237827553
},
{
"x": 831.1473084330056,
"y": 4556.906168368578
},
{
"x": 857.3361013802592,
"y": 5601.1135825435995
},
{
"x": 825.2685900589361,
"y": 4512.684275397905
},
{
"x": 843.4364851713617,
"y": 5555.5135874298
},
{
"x": 776.9989500847432,
"y": 4450.0803030397365
},
{
"x": 854.6214115921446,
"y": 5640.664307158719
},
{
"x": 814.093416705572,
"y": 4075.289522620901
},
{
"x": 843.6425148059775,
"y": 5340.915748007327
},
{
"x": 792.868786194935,
"y": 4826.035298435798
},
{
"x": 823.4755049950965,
"y": 5325.120117106193
},
{
"x": 821.0389569531186,
"y": 4403.429574146611
},
{
"x": 841.6221337428199,
"y": 5394.796730468262
},
{
"x": 800.9564789533496,
"y": 4568.643931901854
},
{
"x": 862.2210443731165,
"y": 5414.641988432062
},
{
"x": 813.2396815646875,
"y": 4497.660915616131
},
{
"x": 818.0610596702088,
"y": 5436.198624142025
},
{
"x": 847.5487129192495,
"y": 4554.415394529245
},
{
"x": 854.0448754636345,
"y": 5204.994721969622
},
{
"x": 826.4942274011869,
"y": 4708.792811721236
}
]
}
],
"drilldown": {},
"tooltip": {
"enabled": true,
"useHTML": false,
"format": null,
"headerFormat": "",
"pointFormat": "<span style=\"color:{series.color}\">Single</span>: <b>{point.x:.0f}</b><br><span style=\"color:{series.color}\">Multi</span>: <b>{point.y:.0f}</b>",
"footerFormat": "",
"shared": false,
"outside": false,
"valueDecimals": null,
"split": false
},
"annotations": null
},
"hc_type": "chart",
"id": "293406730474093798455866647926000953812"
}
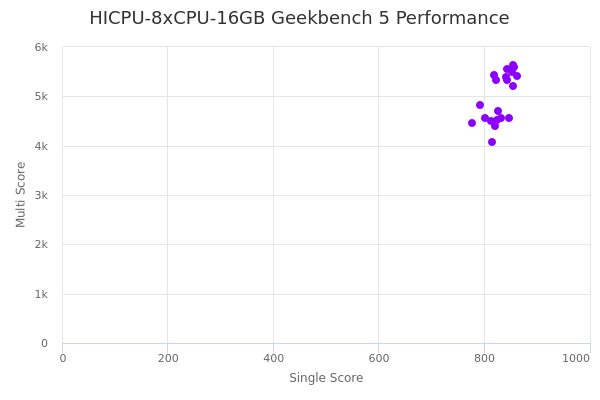
| Single | Multi | |
|---|---|---|
| Max | 862 | 5641 |
| Average | 830 | 4978 |
| Deviation | 22.56 | 489.20 |
| Min | 777 | 4075 |
Sign up as Freemium to get more insight.