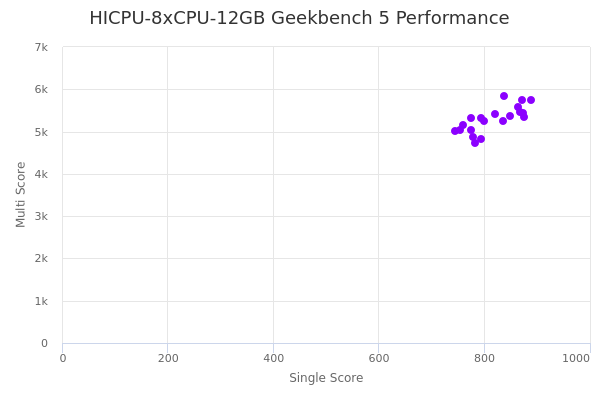
HICPU-8xCPU-12GB by UpCloud
Geekbench is a cross-platform processor benchmark with a scoring system that determines single-core and multi-core performance using loads simulating real-world scenarios. Geekbench 5 score is calculated with a reference score of 2500 representing the performance of the Intel Core i5-2520M @ 2.50 GHz. The software benchmark is available for Mac OS, Windows, Linux, Android and iOS platforms.
Specifications:
CPU
8
RAM
12.0 GB
Root
100 GB
Root HICPU-8xCPU-12GB MaxIOPS
{
"configuration": {
"chart": {
"type": "scatter",
"polar": false,
"zoomType": "",
"options3d": {},
"height": null,
"width": null,
"margin": null,
"inverted": false,
"zooming": {}
},
"credits": {
"enabled": false
},
"title": {
"text": ""
},
"colorAxis": null,
"subtitle": {
"text": ""
},
"xAxis": {
"title": {
"text": [
"Single Score"
],
"useHTML": false,
"style": {
"color": "#666666"
}
},
"categories": null,
"lineWidth": 1,
"tickInterval": null,
"tickWidth": 1,
"tickLength": 10,
"tickPixelInterval": 100,
"plotLines": null,
"labels": {
"enabled": true,
"format": null,
"formatter": "",
"style": {
"color": "#666666",
"cursor": "default",
"fontSize": "11px"
},
"useHTML": false,
"step": 0
},
"plotBands": null,
"visible": true,
"floor": null,
"ceiling": null,
"type": "linear",
"min": 0,
"gridLineWidth": 1,
"gridLineColor": "#e6e6e6",
"minorTickInterval": null,
"minorTickWidth": 0,
"minTickInterval": null,
"startOnTick": true,
"endOnTick": true,
"tickmarkPlacement": 100,
"units": 100,
"minRange": 100
},
"yAxis": {
"title": {
"text": [
"Multi Score"
],
"useHTML": false,
"style": {
"color": "#666666"
}
},
"categories": null,
"plotLines": null,
"plotBands": null,
"lineWidth": null,
"tickInterval": null,
"tickLength": 10,
"floor": null,
"ceiling": null,
"gridLineInterpolation": null,
"gridLineWidth": 1,
"gridLineColor": "#e6e6e6",
"min": 0,
"max": null,
"minorTickInterval": null,
"minorTickWidth": 0,
"minTickInterval": null,
"startOnTick": true,
"endOnTick": true,
"minRange": null,
"type": "linear",
"tickmarkPlacement": null,
"labels": {
"enabled": true,
"formatter": null,
"style": {
"color": "#666666",
"cursor": "default",
"fontSize": "11px"
},
"useHTML": false
}
},
"zAxis": {
"title": {
"text": "Multi Score"
}
},
"plotOptions": {
"series": {
"dataLabels": {
"enabled": false,
"format": null,
"distance": 30,
"align": "center",
"inside": null,
"allowOverlap": false,
"style": {
"fontSize": "11px"
}
},
"showInLegend": null,
"turboThreshold": 0,
"stacking": "",
"groupPadding": 0.2,
"centerInCategory": false,
"findNearestPointBy": "x"
}
},
"navigator": {
"enabled": false
},
"scrollbar": {
"enabled": false
},
"rangeSelector": {
"enabled": false,
"inputEnabled": false
},
"legend": {
"enabled": null,
"maxHeight": null,
"align": "center",
"verticalAlign": "bottom",
"layout": "horizontal",
"width": null,
"margin": 12,
"reversed": false
},
"series": [
{
"name": "HICPU-8xCPU-12GB by UpCloud",
"color": "#8b00ff",
"data": [
{
"x": 838.4053965107244,
"y": 5834.7861798661215
},
{
"x": 793.9819534316351,
"y": 5313.618691014639
},
{
"x": 820.2880484273194,
"y": 5411.402198416313
},
{
"x": 775.4408579506438,
"y": 5316.620645884925
},
{
"x": 874.028544844808,
"y": 5443.801338969236
},
{
"x": 800.1277101442527,
"y": 5240.515601476443
},
{
"x": 888.635289559109,
"y": 5749.688418737376
},
{
"x": 794.4173786009303,
"y": 4826.7520666178
},
{
"x": 867.6207721659281,
"y": 5461.842253416431
},
{
"x": 759.7243209128001,
"y": 5154.108332934353
},
{
"x": 849.8385185031791,
"y": 5359.302792856808
},
{
"x": 753.9067304776705,
"y": 5040.228856789292
},
{
"x": 876.3551837333825,
"y": 5341.356407536719
},
{
"x": 774.8082500797665,
"y": 5037.633577932511
},
{
"x": 836.2212210830378,
"y": 5253.604784681778
},
{
"x": 783.4739701107579,
"y": 4737.407868902981
},
{
"x": 865.172605566124,
"y": 5580.588644408035
},
{
"x": 743.8418429301613,
"y": 5008.380922939879
},
{
"x": 872.6413517891963,
"y": 5741.065250032367
},
{
"x": 778.2812365699023,
"y": 4861.384927805194
}
]
}
],
"drilldown": {},
"tooltip": {
"enabled": true,
"useHTML": false,
"format": null,
"headerFormat": "",
"pointFormat": "<span style=\"color:{series.color}\">Single</span>: <b>{point.x:.0f}</b><br><span style=\"color:{series.color}\">Multi</span>: <b>{point.y:.0f}</b>",
"footerFormat": "",
"shared": false,
"outside": false,
"valueDecimals": null,
"split": false
},
"annotations": null
},
"hc_type": "chart",
"id": "84137897956799260501111309511852643456"
}
| Single | Multi | |
|---|---|---|
| Max | 889 | 5835 |
| Average | 817 | 5286 |
| Deviation | 45.75 | 300.30 |
| Min | 744 | 4737 |
Sign up as Freemium to get more insight.