s2.xlarge.1 by T-Systems Open Telekom Cloud
Geekbench is a cross-platform processor benchmark with a scoring system that determines single-core and multi-core performance using loads simulating real-world scenarios. Geekbench 5 score is calculated with a reference score of 2500 representing the performance of the Intel Core i5-2520M @ 2.50 GHz. The software benchmark is available for Mac OS, Windows, Linux, Android and iOS platforms.
Specifications:
CPU
4
RAM
4.0 GB
{
"configuration": {
"chart": {
"type": "scatter",
"polar": false,
"zoomType": "",
"options3d": {},
"height": null,
"width": null,
"margin": null,
"inverted": false,
"zooming": {}
},
"credits": {
"enabled": false
},
"title": {
"text": ""
},
"colorAxis": null,
"subtitle": {
"text": ""
},
"xAxis": {
"title": {
"text": [
"Single Score"
],
"useHTML": false,
"style": {
"color": "#666666"
}
},
"categories": null,
"lineWidth": 1,
"tickInterval": null,
"tickWidth": 1,
"tickLength": 10,
"tickPixelInterval": 100,
"plotLines": null,
"labels": {
"enabled": true,
"format": null,
"formatter": "",
"style": {
"color": "#666666",
"cursor": "default",
"fontSize": "11px"
},
"useHTML": false,
"step": 0
},
"plotBands": null,
"visible": true,
"floor": null,
"ceiling": null,
"type": "linear",
"min": 0,
"gridLineWidth": 1,
"gridLineColor": "#e6e6e6",
"minorTickInterval": null,
"minorTickWidth": 0,
"minTickInterval": null,
"startOnTick": true,
"endOnTick": true,
"tickmarkPlacement": 100,
"units": 100,
"minRange": 100
},
"yAxis": {
"title": {
"text": [
"Multi Score"
],
"useHTML": false,
"style": {
"color": "#666666"
}
},
"categories": null,
"plotLines": null,
"plotBands": null,
"lineWidth": null,
"tickInterval": null,
"tickLength": 10,
"floor": null,
"ceiling": null,
"gridLineInterpolation": null,
"gridLineWidth": 1,
"gridLineColor": "#e6e6e6",
"min": 0,
"max": null,
"minorTickInterval": null,
"minorTickWidth": 0,
"minTickInterval": null,
"startOnTick": true,
"endOnTick": true,
"minRange": null,
"type": "linear",
"tickmarkPlacement": null,
"labels": {
"enabled": true,
"formatter": null,
"style": {
"color": "#666666",
"cursor": "default",
"fontSize": "11px"
},
"useHTML": false
}
},
"zAxis": {
"title": {
"text": "Multi Score"
}
},
"plotOptions": {
"series": {
"dataLabels": {
"enabled": false,
"format": null,
"distance": 30,
"align": "center",
"inside": null,
"allowOverlap": false,
"style": {
"fontSize": "11px"
}
},
"showInLegend": null,
"turboThreshold": 0,
"stacking": "",
"groupPadding": 0.2,
"centerInCategory": false,
"findNearestPointBy": "x"
}
},
"navigator": {
"enabled": false
},
"scrollbar": {
"enabled": false
},
"rangeSelector": {
"enabled": false,
"inputEnabled": false
},
"legend": {
"enabled": null,
"maxHeight": null,
"align": "center",
"verticalAlign": "bottom",
"layout": "horizontal",
"width": null,
"margin": 12,
"reversed": false
},
"series": [
{
"name": "s2.xlarge.1 by T-Systems Open Telekom Cloud",
"color": "#d1006c",
"data": [
{
"x": 731.9677681096282,
"y": 2883.5765285408283
},
{
"x": 730.1996203808357,
"y": 2851.2416210226374
},
{
"x": 750.3220216743646,
"y": 2903.039015611602
},
{
"x": 727.0220484488934,
"y": 2794.791335616922
},
{
"x": 726.4670103864806,
"y": 2756.7917217189506
},
{
"x": 725.2338664050152,
"y": 2702.006060686322
},
{
"x": 738.5278269491102,
"y": 2853.1825546622636
},
{
"x": 718.8555886931002,
"y": 2692.3653522148347
},
{
"x": 739.8852476322492,
"y": 2874.9426731571316
},
{
"x": 718.5130221897119,
"y": 2664.5106658610807
},
{
"x": 742.1415523820431,
"y": 2877.390171842508
},
{
"x": 713.9922159207621,
"y": 2780.707795373796
},
{
"x": 736.354321783656,
"y": 2878.661656148265
},
{
"x": 719.9250524112697,
"y": 2717.7855943345203
},
{
"x": 745.9185471073246,
"y": 2853.3707810461456
},
{
"x": 721.0539050142004,
"y": 2769.100460195612
},
{
"x": 741.1970284731616,
"y": 2888.9759972058982
},
{
"x": 716.5089424153362,
"y": 2734.5358764178063
},
{
"x": 743.043181759847,
"y": 2882.797601030709
},
{
"x": 716.1928314336678,
"y": 2760.0405079731145
},
{
"x": 742.3089061228548,
"y": 2884.159813081937
},
{
"x": 714.9283239551424,
"y": 2767.2185220704523
},
{
"x": 741.6470923907191,
"y": 2888.0177315778856
},
{
"x": 717.4130199140247,
"y": 2780.881328229458
},
{
"x": 743.0825142738963,
"y": 2863.09140196764
},
{
"x": 719.5249180203168,
"y": 2799.4744559232704
},
{
"x": 664.4532120225404,
"y": 2514.080704316253
},
{
"x": 650.7052947674305,
"y": 2428.653322497981
},
{
"x": 662.1373063120803,
"y": 2493.9482443035795
},
{
"x": 647.506609042319,
"y": 2402.866775983091
},
{
"x": 657.7977637568392,
"y": 2525.054618044407
},
{
"x": 647.4737545099586,
"y": 2476.7469758999077
},
{
"x": 648.2742449874202,
"y": 2479.216853251182
},
{
"x": 653.1732417642769,
"y": 2468.5968969400496
},
{
"x": 664.366325441941,
"y": 2514.2314679136803
},
{
"x": 644.5036152626963,
"y": 2482.3868931494603
}
]
}
],
"drilldown": {},
"tooltip": {
"enabled": true,
"useHTML": false,
"format": null,
"headerFormat": "",
"pointFormat": "<span style=\"color:{series.color}\">Single</span>: <b>{point.x:.0f}</b><br><span style=\"color:{series.color}\">Multi</span>: <b>{point.y:.0f}</b>",
"footerFormat": "",
"shared": false,
"outside": false,
"valueDecimals": null,
"split": false
},
"annotations": null
},
"hc_type": "chart",
"id": "295197401567358628604502687972374541772"
}
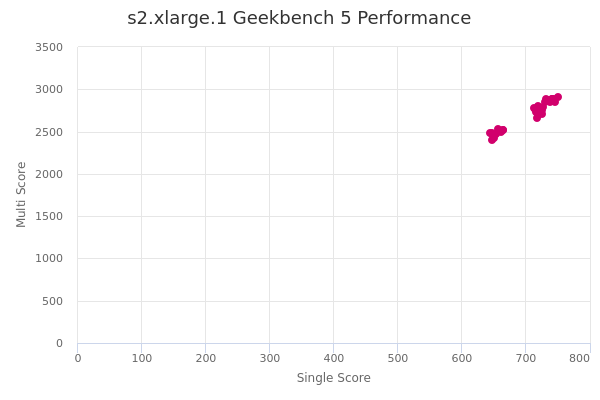
| Single | Multi | |
|---|---|---|
| Max | 750 | 2903 |
| Average | 709 | 2719 |
| Deviation | 35.62 | 162.02 |
| Min | 645 | 2403 |
Sign up as Freemium to get more insight.
- In same series
- s2.medium.1
- s2.medium.2
- s2.medium.4
- s2.medium.8
- s2.large.1
- s2.large.2
- s2.large.4
- s2.large.8
- s2.xlarge.1
- s2.xlarge.2
- s2.xlarge.4
- s2.xlarge.8
- s2.2xlarge.1
- s2.2xlarge.2
- s2.2xlarge.4
- s2.2xlarge.8
- s2.4xlarge.1
- s2.4xlarge.2
- s2.4xlarge.4
- s2.4xlarge.8
- s2.8xlarge.1
- s2.8xlarge.2
- s2.8xlarge.4
- s2.8xlarge.8