s2.medium.1 by T-Systems Open Telekom Cloud
Geekbench is a cross-platform processor benchmark with a scoring system that determines single-core and multi-core performance using loads simulating real-world scenarios. Geekbench 5 score is calculated with a reference score of 2500 representing the performance of the Intel Core i5-2520M @ 2.50 GHz. The software benchmark is available for Mac OS, Windows, Linux, Android and iOS platforms.
Specifications:
CPU
1
RAM
1.0 GB
{
"configuration": {
"chart": {
"type": "scatter",
"polar": false,
"zoomType": "",
"options3d": {},
"height": null,
"width": null,
"margin": null,
"inverted": false,
"zooming": {}
},
"credits": {
"enabled": false
},
"title": {
"text": ""
},
"colorAxis": null,
"subtitle": {
"text": ""
},
"xAxis": {
"title": {
"text": [
"Single Score"
],
"useHTML": false,
"style": {
"color": "#666666"
}
},
"categories": null,
"lineWidth": 1,
"tickInterval": null,
"tickWidth": 1,
"tickLength": 10,
"tickPixelInterval": 100,
"plotLines": null,
"labels": {
"enabled": true,
"format": null,
"formatter": "",
"style": {
"color": "#666666",
"cursor": "default",
"fontSize": "11px"
},
"useHTML": false,
"step": 0
},
"plotBands": null,
"visible": true,
"floor": null,
"ceiling": null,
"type": "linear",
"min": 0,
"gridLineWidth": 1,
"gridLineColor": "#e6e6e6",
"minorTickInterval": null,
"minorTickWidth": 0,
"minTickInterval": null,
"startOnTick": true,
"endOnTick": true,
"tickmarkPlacement": 100,
"units": 100,
"minRange": 100
},
"yAxis": {
"title": {
"text": [
"Multi Score"
],
"useHTML": false,
"style": {
"color": "#666666"
}
},
"categories": null,
"plotLines": null,
"plotBands": null,
"lineWidth": null,
"tickInterval": null,
"tickLength": 10,
"floor": null,
"ceiling": null,
"gridLineInterpolation": null,
"gridLineWidth": 1,
"gridLineColor": "#e6e6e6",
"min": 0,
"max": null,
"minorTickInterval": null,
"minorTickWidth": 0,
"minTickInterval": null,
"startOnTick": true,
"endOnTick": true,
"minRange": null,
"type": "linear",
"tickmarkPlacement": null,
"labels": {
"enabled": true,
"formatter": null,
"style": {
"color": "#666666",
"cursor": "default",
"fontSize": "11px"
},
"useHTML": false
}
},
"zAxis": {
"title": {
"text": "Multi Score"
}
},
"plotOptions": {
"series": {
"dataLabels": {
"enabled": false,
"format": null,
"distance": 30,
"align": "center",
"inside": null,
"allowOverlap": false,
"style": {
"fontSize": "11px"
}
},
"showInLegend": null,
"turboThreshold": 0,
"stacking": "",
"groupPadding": 0.2,
"centerInCategory": false,
"findNearestPointBy": "x"
}
},
"navigator": {
"enabled": false
},
"scrollbar": {
"enabled": false
},
"rangeSelector": {
"enabled": false,
"inputEnabled": false
},
"legend": {
"enabled": null,
"maxHeight": null,
"align": "center",
"verticalAlign": "bottom",
"layout": "horizontal",
"width": null,
"margin": 12,
"reversed": false
},
"series": [
{
"name": "s2.medium.1 by T-Systems Open Telekom Cloud",
"color": "#d1006c",
"data": [
{
"x": 665.7245478768889,
"y": 668.8384689550667
},
{
"x": 656.0646824778722,
"y": 651.1290761592685
},
{
"x": 658.0775952395068,
"y": 652.8066335726276
},
{
"x": 654.9160899242387,
"y": 650.8002218556801
},
{
"x": 665.1121709992503,
"y": 653.991012189724
},
{
"x": 658.807421729856,
"y": 652.1764251331288
},
{
"x": 662.8352614471473,
"y": 662.5535357766214
},
{
"x": 647.6243893484163,
"y": 654.5739757752249
},
{
"x": 664.8184646740989,
"y": 665.0062011080596
},
{
"x": 604.5944032167365,
"y": 656.3125878656314
},
{
"x": 651.8915094431499,
"y": 654.4069697518312
},
{
"x": 651.8852438861184,
"y": 647.3947151601226
},
{
"x": 647.0797552199605,
"y": 650.1884205152571
},
{
"x": 646.2892252764265,
"y": 650.9150923762145
},
{
"x": 647.7449803990397,
"y": 654.5625882427748
},
{
"x": 655.6593104292893,
"y": 653.9662454896073
},
{
"x": 648.3524963133065,
"y": 654.0523828593264
},
{
"x": 644.4969347943855,
"y": 648.4468048740504
},
{
"x": 638.0336108313924,
"y": 647.3903546633869
},
{
"x": 652.7986828357632,
"y": 650.0635608385174
}
]
}
],
"drilldown": {},
"tooltip": {
"enabled": true,
"useHTML": false,
"format": null,
"headerFormat": "",
"pointFormat": "<span style=\"color:{series.color}\">Single</span>: <b>{point.x:.0f}</b><br><span style=\"color:{series.color}\">Multi</span>: <b>{point.y:.0f}</b>",
"footerFormat": "",
"shared": false,
"outside": false,
"valueDecimals": null,
"split": false
},
"annotations": null
},
"hc_type": "chart",
"id": "115808595308457951230781146628973476758"
}
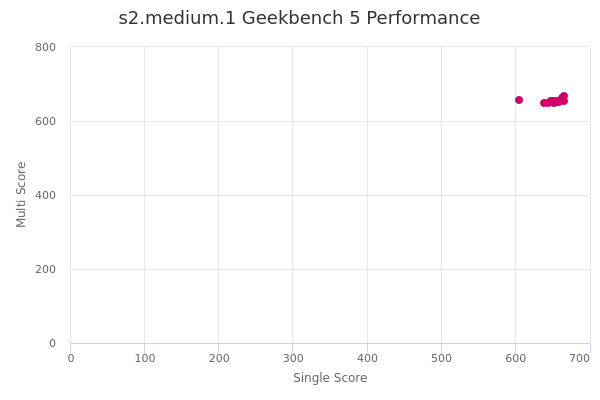
| Single | Multi | |
|---|---|---|
| Max | 666 | 669 |
| Average | 651 | 654 |
| Deviation | 12.95 | 5.48 |
| Min | 605 | 647 |
Sign up as Freemium to get more insight.
- In same series
- s2.medium.1
- s2.medium.2
- s2.medium.4
- s2.medium.8
- s2.large.1
- s2.large.2
- s2.large.4
- s2.large.8
- s2.xlarge.1
- s2.xlarge.2
- s2.xlarge.4
- s2.xlarge.8
- s2.2xlarge.1
- s2.2xlarge.2
- s2.2xlarge.4
- s2.2xlarge.8
- s2.4xlarge.1
- s2.4xlarge.2
- s2.4xlarge.4
- s2.4xlarge.8
- s2.8xlarge.1
- s2.8xlarge.2
- s2.8xlarge.4
- s2.8xlarge.8