m4.2xlarge.8 by T-Systems Open Telekom Cloud
Geekbench is a cross-platform processor benchmark with a scoring system that determines single-core and multi-core performance using loads simulating real-world scenarios. Geekbench 5 score is calculated with a reference score of 2500 representing the performance of the Intel Core i5-2520M @ 2.50 GHz. The software benchmark is available for Mac OS, Windows, Linux, Android and iOS platforms.
Specifications:
CPU
8
RAM
64.0 GB
{
"configuration": {
"chart": {
"type": "scatter",
"polar": false,
"zoomType": "",
"options3d": {},
"height": null,
"width": null,
"margin": null,
"inverted": false,
"zooming": {}
},
"credits": {
"enabled": false
},
"title": {
"text": ""
},
"colorAxis": null,
"subtitle": {
"text": ""
},
"xAxis": {
"title": {
"text": [
"Single Score"
],
"useHTML": false,
"style": {
"color": "#666666"
}
},
"categories": null,
"lineWidth": 1,
"tickInterval": null,
"tickWidth": 1,
"tickLength": 10,
"tickPixelInterval": 100,
"plotLines": null,
"labels": {
"enabled": true,
"format": null,
"formatter": "",
"style": {
"color": "#666666",
"cursor": "default",
"fontSize": "11px"
},
"useHTML": false,
"step": 0
},
"plotBands": null,
"visible": true,
"floor": null,
"ceiling": null,
"type": "linear",
"min": 0,
"gridLineWidth": 1,
"gridLineColor": "#e6e6e6",
"minorTickInterval": null,
"minorTickWidth": 0,
"minTickInterval": null,
"startOnTick": true,
"endOnTick": true,
"tickmarkPlacement": 100,
"units": 100,
"minRange": 100
},
"yAxis": {
"title": {
"text": [
"Multi Score"
],
"useHTML": false,
"style": {
"color": "#666666"
}
},
"categories": null,
"plotLines": null,
"plotBands": null,
"lineWidth": null,
"tickInterval": null,
"tickLength": 10,
"floor": null,
"ceiling": null,
"gridLineInterpolation": null,
"gridLineWidth": 1,
"gridLineColor": "#e6e6e6",
"min": 0,
"max": null,
"minorTickInterval": null,
"minorTickWidth": 0,
"minTickInterval": null,
"startOnTick": true,
"endOnTick": true,
"minRange": null,
"type": "linear",
"tickmarkPlacement": null,
"labels": {
"enabled": true,
"formatter": null,
"style": {
"color": "#666666",
"cursor": "default",
"fontSize": "11px"
},
"useHTML": false
}
},
"zAxis": {
"title": {
"text": "Multi Score"
}
},
"plotOptions": {
"series": {
"dataLabels": {
"enabled": false,
"format": null,
"distance": 30,
"align": "center",
"inside": null,
"allowOverlap": false,
"style": {
"fontSize": "11px"
}
},
"showInLegend": null,
"turboThreshold": 0,
"stacking": "",
"groupPadding": 0.2,
"centerInCategory": false,
"findNearestPointBy": "x"
}
},
"navigator": {
"enabled": false
},
"scrollbar": {
"enabled": false
},
"rangeSelector": {
"enabled": false,
"inputEnabled": false
},
"legend": {
"enabled": null,
"maxHeight": null,
"align": "center",
"verticalAlign": "bottom",
"layout": "horizontal",
"width": null,
"margin": 12,
"reversed": false
},
"series": [
{
"name": "m4.2xlarge.8 by T-Systems Open Telekom Cloud",
"color": "#d1006c",
"data": [
{
"x": 892.9389345505824,
"y": 6588.6632139088515
},
{
"x": 893.2449215572968,
"y": 6547.016687792723
},
{
"x": 893.7020676984835,
"y": 6410.714190135073
},
{
"x": 892.6083984285347,
"y": 6428.013058531467
},
{
"x": 892.7932231414433,
"y": 6606.544747502068
},
{
"x": 894.3811975843555,
"y": 6565.509830377654
},
{
"x": 894.3129371198434,
"y": 6558.888234925194
},
{
"x": 897.8787583519173,
"y": 6598.065778113034
},
{
"x": 892.9168851553117,
"y": 6579.65866149101
},
{
"x": 893.6956444839386,
"y": 6611.639765778702
},
{
"x": 894.6411420438233,
"y": 6698.075610649532
},
{
"x": 906.0306002161813,
"y": 6576.579323881758
},
{
"x": 902.6436400678581,
"y": 6789.629425019733
},
{
"x": 891.0805626893481,
"y": 6634.952496697157
},
{
"x": 896.6962347261027,
"y": 6788.057481873051
},
{
"x": 908.4569401013738,
"y": 6731.4685800278985
},
{
"x": 900.9669331397553,
"y": 6769.968230427356
},
{
"x": 913.4463274027504,
"y": 6671.544302804607
},
{
"x": 899.7244066132317,
"y": 6737.7816578668
},
{
"x": 911.9547453662103,
"y": 6326.614706277964
},
{
"x": 903.1831305451842,
"y": 6785.782415656682
},
{
"x": 911.2925331458414,
"y": 6357.74668287906
},
{
"x": 898.665244728104,
"y": 6761.502482453168
},
{
"x": 890.1606014743581,
"y": 6559.604977037744
},
{
"x": 897.7120958530488,
"y": 6772.672824049911
},
{
"x": 900.9230519657256,
"y": 6375.865435401952
},
{
"x": 899.5293396356292,
"y": 6767.194795802801
},
{
"x": 905.6878640205955,
"y": 6583.970314966542
},
{
"x": 902.1771488188442,
"y": 6783.211698028686
},
{
"x": 908.5237056923994,
"y": 6646.815929810392
}
]
}
],
"drilldown": {},
"tooltip": {
"enabled": true,
"useHTML": false,
"format": null,
"headerFormat": "",
"pointFormat": "<span style=\"color:{series.color}\">Single</span>: <b>{point.x:.0f}</b><br><span style=\"color:{series.color}\">Multi</span>: <b>{point.y:.0f}</b>",
"footerFormat": "",
"shared": false,
"outside": false,
"valueDecimals": null,
"split": false
},
"annotations": null
},
"hc_type": "chart",
"id": "274968808509554936641453673310130218672"
}
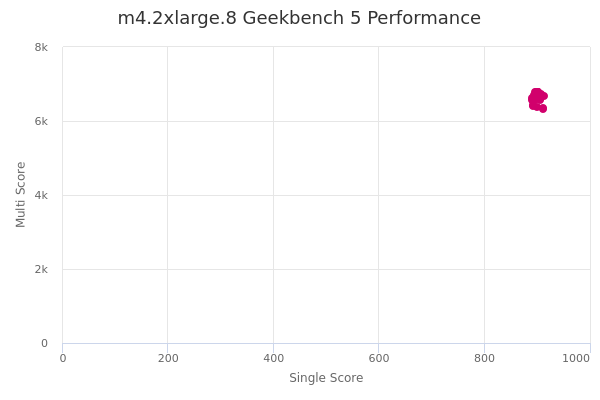
| Single | Multi | |
|---|---|---|
| Max | 913 | 6790 |
| Average | 899 | 6620 |
| Deviation | 6.58 | 135.64 |
| Min | 890 | 6327 |
Sign up as Freemium to get more insight.