m4.16xlarge.8 by T-Systems Open Telekom Cloud
Geekbench is a cross-platform processor benchmark with a scoring system that determines single-core and multi-core performance using loads simulating real-world scenarios. Geekbench 5 score is calculated with a reference score of 2500 representing the performance of the Intel Core i5-2520M @ 2.50 GHz. The software benchmark is available for Mac OS, Windows, Linux, Android and iOS platforms.
Specifications:
CPU
64
RAM
512.0 GB
{
"configuration": {
"chart": {
"type": "scatter",
"polar": false,
"zoomType": "",
"options3d": {},
"height": null,
"width": null,
"margin": null,
"inverted": false,
"zooming": {}
},
"credits": {
"enabled": false
},
"title": {
"text": ""
},
"colorAxis": null,
"subtitle": {
"text": ""
},
"xAxis": {
"title": {
"text": [
"Single Score"
],
"useHTML": false,
"style": {
"color": "#666666"
}
},
"categories": null,
"lineWidth": 1,
"tickInterval": null,
"tickWidth": 1,
"tickLength": 10,
"tickPixelInterval": 100,
"plotLines": null,
"labels": {
"enabled": true,
"format": null,
"formatter": "",
"style": {
"color": "#666666",
"cursor": "default",
"fontSize": "11px"
},
"useHTML": false,
"step": 0
},
"plotBands": null,
"visible": true,
"floor": null,
"ceiling": null,
"type": "linear",
"min": 0,
"gridLineWidth": 1,
"gridLineColor": "#e6e6e6",
"minorTickInterval": null,
"minorTickWidth": 0,
"minTickInterval": null,
"startOnTick": true,
"endOnTick": true,
"tickmarkPlacement": 100,
"units": 100,
"minRange": 100
},
"yAxis": {
"title": {
"text": [
"Multi Score"
],
"useHTML": false,
"style": {
"color": "#666666"
}
},
"categories": null,
"plotLines": null,
"plotBands": null,
"lineWidth": null,
"tickInterval": null,
"tickLength": 10,
"floor": null,
"ceiling": null,
"gridLineInterpolation": null,
"gridLineWidth": 1,
"gridLineColor": "#e6e6e6",
"min": 0,
"max": null,
"minorTickInterval": null,
"minorTickWidth": 0,
"minTickInterval": null,
"startOnTick": true,
"endOnTick": true,
"minRange": null,
"type": "linear",
"tickmarkPlacement": null,
"labels": {
"enabled": true,
"formatter": null,
"style": {
"color": "#666666",
"cursor": "default",
"fontSize": "11px"
},
"useHTML": false
}
},
"zAxis": {
"title": {
"text": "Multi Score"
}
},
"plotOptions": {
"series": {
"dataLabels": {
"enabled": false,
"format": null,
"distance": 30,
"align": "center",
"inside": null,
"allowOverlap": false,
"style": {
"fontSize": "11px"
}
},
"showInLegend": null,
"turboThreshold": 0,
"stacking": "",
"groupPadding": 0.2,
"centerInCategory": false,
"findNearestPointBy": "x"
}
},
"navigator": {
"enabled": false
},
"scrollbar": {
"enabled": false
},
"rangeSelector": {
"enabled": false,
"inputEnabled": false
},
"legend": {
"enabled": null,
"maxHeight": null,
"align": "center",
"verticalAlign": "bottom",
"layout": "horizontal",
"width": null,
"margin": 12,
"reversed": false
},
"series": [
{
"name": "m4.16xlarge.8 by T-Systems Open Telekom Cloud",
"color": "#d1006c",
"data": [
{
"x": 890.2927168665091,
"y": 25092.854135425914
},
{
"x": 887.4654961900283,
"y": 25395.616347828443
},
{
"x": 889.2708849772382,
"y": 25478.032309121503
},
{
"x": 884.8096668872702,
"y": 25028.90624012521
},
{
"x": 881.1657016979293,
"y": 24893.84650070955
},
{
"x": 879.2496254553112,
"y": 24544.611517799127
},
{
"x": 889.5192351391785,
"y": 25237.66697935811
},
{
"x": 877.2882335416896,
"y": 25250.021939038994
},
{
"x": 877.5162918017377,
"y": 25634.763285073754
},
{
"x": 884.9284137902796,
"y": 25454.512963802714
},
{
"x": 885.957699195036,
"y": 25593.751643281234
},
{
"x": 880.0241848146297,
"y": 24678.220426001728
},
{
"x": 877.2412946320956,
"y": 25505.48897541454
},
{
"x": 877.6067239444703,
"y": 25326.931156662144
},
{
"x": 888.0503690513538,
"y": 25694.792378346516
},
{
"x": 889.4190748256992,
"y": 24989.863749518096
},
{
"x": 878.5736846996195,
"y": 24819.081874489497
},
{
"x": 890.1060153980601,
"y": 25361.647067114554
},
{
"x": 882.4563356520221,
"y": 25099.780795353698
},
{
"x": 877.1544118365683,
"y": 25305.253161400076
}
]
}
],
"drilldown": {},
"tooltip": {
"enabled": true,
"useHTML": false,
"format": null,
"headerFormat": "",
"pointFormat": "<span style=\"color:{series.color}\">Single</span>: <b>{point.x:.0f}</b><br><span style=\"color:{series.color}\">Multi</span>: <b>{point.y:.0f}</b>",
"footerFormat": "",
"shared": false,
"outside": false,
"valueDecimals": null,
"split": false
},
"annotations": null
},
"hc_type": "chart",
"id": "68287365201028427055845120487710814376"
}
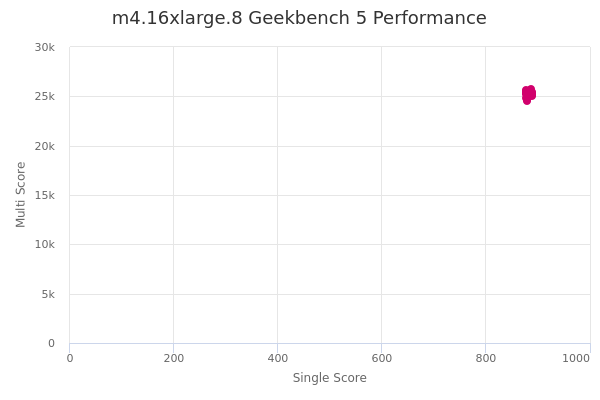
| Single | Multi | |
|---|---|---|
| Max | 890 | 25695 |
| Average | 883 | 25219 |
| Deviation | 4.95 | 312.08 |
| Min | 877 | 24545 |
Sign up as Freemium to get more insight.