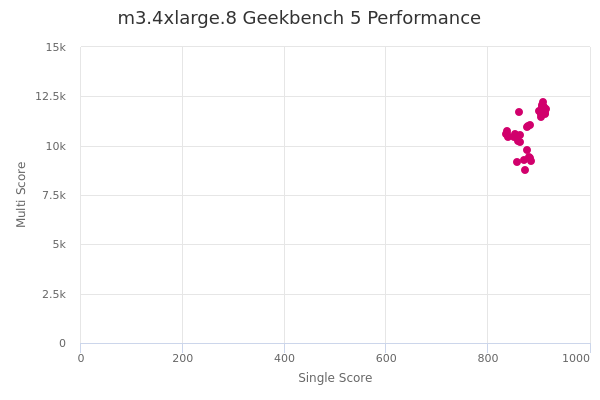
m3.4xlarge.8 by T-Systems Open Telekom Cloud
Geekbench is a cross-platform processor benchmark with a scoring system that determines single-core and multi-core performance using loads simulating real-world scenarios. Geekbench 5 score is calculated with a reference score of 2500 representing the performance of the Intel Core i5-2520M @ 2.50 GHz. The software benchmark is available for Mac OS, Windows, Linux, Android and iOS platforms.
Specifications:
CPU
16
RAM
128.0 GB
{
"configuration": {
"chart": {
"type": "scatter",
"polar": false,
"zoomType": "",
"options3d": {},
"height": null,
"width": null,
"margin": null,
"inverted": false,
"zooming": {}
},
"credits": {
"enabled": false
},
"title": {
"text": ""
},
"colorAxis": null,
"subtitle": {
"text": ""
},
"xAxis": {
"title": {
"text": [
"Single Score"
],
"useHTML": false,
"style": {
"color": "#666666"
}
},
"categories": null,
"lineWidth": 1,
"tickInterval": null,
"tickWidth": 1,
"tickLength": 10,
"tickPixelInterval": 100,
"plotLines": null,
"labels": {
"enabled": true,
"format": null,
"formatter": "",
"style": {
"color": "#666666",
"cursor": "default",
"fontSize": "11px"
},
"useHTML": false,
"step": 0
},
"plotBands": null,
"visible": true,
"floor": null,
"ceiling": null,
"type": "linear",
"min": 0,
"gridLineWidth": 1,
"gridLineColor": "#e6e6e6",
"minorTickInterval": null,
"minorTickWidth": 0,
"minTickInterval": null,
"startOnTick": true,
"endOnTick": true,
"tickmarkPlacement": 100,
"units": 100,
"minRange": 100
},
"yAxis": {
"title": {
"text": [
"Multi Score"
],
"useHTML": false,
"style": {
"color": "#666666"
}
},
"categories": null,
"plotLines": null,
"plotBands": null,
"lineWidth": null,
"tickInterval": null,
"tickLength": 10,
"floor": null,
"ceiling": null,
"gridLineInterpolation": null,
"gridLineWidth": 1,
"gridLineColor": "#e6e6e6",
"min": 0,
"max": null,
"minorTickInterval": null,
"minorTickWidth": 0,
"minTickInterval": null,
"startOnTick": true,
"endOnTick": true,
"minRange": null,
"type": "linear",
"tickmarkPlacement": null,
"labels": {
"enabled": true,
"formatter": null,
"style": {
"color": "#666666",
"cursor": "default",
"fontSize": "11px"
},
"useHTML": false
}
},
"zAxis": {
"title": {
"text": "Multi Score"
}
},
"plotOptions": {
"series": {
"dataLabels": {
"enabled": false,
"format": null,
"distance": 30,
"align": "center",
"inside": null,
"allowOverlap": false,
"style": {
"fontSize": "11px"
}
},
"showInLegend": null,
"turboThreshold": 0,
"stacking": "",
"groupPadding": 0.2,
"centerInCategory": false,
"findNearestPointBy": "x"
}
},
"navigator": {
"enabled": false
},
"scrollbar": {
"enabled": false
},
"rangeSelector": {
"enabled": false,
"inputEnabled": false
},
"legend": {
"enabled": null,
"maxHeight": null,
"align": "center",
"verticalAlign": "bottom",
"layout": "horizontal",
"width": null,
"margin": 12,
"reversed": false
},
"series": [
{
"name": "m3.4xlarge.8 by T-Systems Open Telekom Cloud",
"color": "#d1006c",
"data": [
{
"x": 863.9196975759994,
"y": 10206.312292486455
},
{
"x": 857.3592728339434,
"y": 9150.982684898161
},
{
"x": 859.1173439719537,
"y": 10219.110596586183
},
{
"x": 879.5409395090824,
"y": 10987.024360236053
},
{
"x": 837.7104904768956,
"y": 10758.769799775673
},
{
"x": 873.9609739039537,
"y": 8757.89977413876
},
{
"x": 839.530598076433,
"y": 10421.929854696456
},
{
"x": 884.0106092531421,
"y": 9370.090058615257
},
{
"x": 852.6158862460468,
"y": 10421.814005397036
},
{
"x": 881.2532938097821,
"y": 9439.553727543982
},
{
"x": 835.7156757323438,
"y": 10576.88494612483
},
{
"x": 876.2883438894303,
"y": 10968.257924657155
},
{
"x": 854.5074864348204,
"y": 10582.407979418167
},
{
"x": 878.0792820905864,
"y": 9773.291683793164
},
{
"x": 838.7395260670733,
"y": 10594.306382655492
},
{
"x": 883.9991669403139,
"y": 11043.943410957836
},
{
"x": 862.5671349748386,
"y": 10547.556258715716
},
{
"x": 871.9313269468566,
"y": 9258.448149215004
},
{
"x": 860.5708193095218,
"y": 11695.272590725817
},
{
"x": 884.5194191825519,
"y": 9237.535869123
},
{
"x": 906.7682582196524,
"y": 11935.229418070148
},
{
"x": 909.862924897059,
"y": 11954.497782063116
},
{
"x": 900.9497978298324,
"y": 11758.933002304131
},
{
"x": 913.5329287314835,
"y": 11634.355092827813
},
{
"x": 905.368026294512,
"y": 11654.103717822309
},
{
"x": 913.7697269383061,
"y": 11844.969132466471
},
{
"x": 905.3781909907966,
"y": 11621.404174212554
},
{
"x": 913.0814876833656,
"y": 11595.48540121491
},
{
"x": 912.3310641708593,
"y": 11786.875665141111
},
{
"x": 904.0803001138527,
"y": 11460.16638702207
},
{
"x": 908.8930941998401,
"y": 11996.178333541426
},
{
"x": 904.0401899628296,
"y": 11809.805022404065
},
{
"x": 908.1093829654442,
"y": 11881.913151358745
},
{
"x": 907.6390623825228,
"y": 11757.28619831491
},
{
"x": 912.0948588875759,
"y": 11857.367537718712
},
{
"x": 903.863959800942,
"y": 11666.601939053326
},
{
"x": 908.5912505071935,
"y": 12217.565989320294
},
{
"x": 906.9945429929196,
"y": 11728.33260843379
},
{
"x": 910.7928917220266,
"y": 11886.096042542895
},
{
"x": 906.6366590584234,
"y": 12082.103323206175
}
]
}
],
"drilldown": {},
"tooltip": {
"enabled": true,
"useHTML": false,
"format": null,
"headerFormat": "",
"pointFormat": "<span style=\"color:{series.color}\">Single</span>: <b>{point.x:.0f}</b><br><span style=\"color:{series.color}\">Multi</span>: <b>{point.y:.0f}</b>",
"footerFormat": "",
"shared": false,
"outside": false,
"valueDecimals": null,
"split": false
},
"annotations": null
},
"hc_type": "chart",
"id": "91886624116817605098093745179292991"
}
| Single | Multi | |
|---|---|---|
| Max | 914 | 12218 |
| Average | 886 | 11004 |
| Deviation | 25.11 | 974.45 |
| Min | 836 | 8758 |
Sign up as Freemium to get more insight.
- In same series
- m3.medium.8
- m3.large.8
- m3.xlarge.8
- m3.2xlarge.8
- m3.4xlarge.8
- m3.8xlarge.8
- m3.15xlarge.8