m3.2xlarge.8 by T-Systems Open Telekom Cloud
Geekbench is a cross-platform processor benchmark with a scoring system that determines single-core and multi-core performance using loads simulating real-world scenarios. Geekbench 5 score is calculated with a reference score of 2500 representing the performance of the Intel Core i5-2520M @ 2.50 GHz. The software benchmark is available for Mac OS, Windows, Linux, Android and iOS platforms.
Specifications:
CPU
8
RAM
64.0 GB
{
"configuration": {
"chart": {
"type": "scatter",
"polar": false,
"zoomType": "",
"options3d": {},
"height": null,
"width": null,
"margin": null,
"inverted": false,
"zooming": {}
},
"credits": {
"enabled": false
},
"title": {
"text": ""
},
"colorAxis": null,
"subtitle": {
"text": ""
},
"xAxis": {
"title": {
"text": [
"Single Score"
],
"useHTML": false,
"style": {
"color": "#666666"
}
},
"categories": null,
"lineWidth": 1,
"tickInterval": null,
"tickWidth": 1,
"tickLength": 10,
"tickPixelInterval": 100,
"plotLines": null,
"labels": {
"enabled": true,
"format": null,
"formatter": "",
"style": {
"color": "#666666",
"cursor": "default",
"fontSize": "11px"
},
"useHTML": false,
"step": 0
},
"plotBands": null,
"visible": true,
"floor": null,
"ceiling": null,
"type": "linear",
"min": 0,
"gridLineWidth": 1,
"gridLineColor": "#e6e6e6",
"minorTickInterval": null,
"minorTickWidth": 0,
"minTickInterval": null,
"startOnTick": true,
"endOnTick": true,
"tickmarkPlacement": 100,
"units": 100,
"minRange": 100
},
"yAxis": {
"title": {
"text": [
"Multi Score"
],
"useHTML": false,
"style": {
"color": "#666666"
}
},
"categories": null,
"plotLines": null,
"plotBands": null,
"lineWidth": null,
"tickInterval": null,
"tickLength": 10,
"floor": null,
"ceiling": null,
"gridLineInterpolation": null,
"gridLineWidth": 1,
"gridLineColor": "#e6e6e6",
"min": 0,
"max": null,
"minorTickInterval": null,
"minorTickWidth": 0,
"minTickInterval": null,
"startOnTick": true,
"endOnTick": true,
"minRange": null,
"type": "linear",
"tickmarkPlacement": null,
"labels": {
"enabled": true,
"formatter": null,
"style": {
"color": "#666666",
"cursor": "default",
"fontSize": "11px"
},
"useHTML": false
}
},
"zAxis": {
"title": {
"text": "Multi Score"
}
},
"plotOptions": {
"series": {
"dataLabels": {
"enabled": false,
"format": null,
"distance": 30,
"align": "center",
"inside": null,
"allowOverlap": false,
"style": {
"fontSize": "11px"
}
},
"showInLegend": null,
"turboThreshold": 0,
"stacking": "",
"groupPadding": 0.2,
"centerInCategory": false,
"findNearestPointBy": "x"
}
},
"navigator": {
"enabled": false
},
"scrollbar": {
"enabled": false
},
"rangeSelector": {
"enabled": false,
"inputEnabled": false
},
"legend": {
"enabled": null,
"maxHeight": null,
"align": "center",
"verticalAlign": "bottom",
"layout": "horizontal",
"width": null,
"margin": 12,
"reversed": false
},
"series": [
{
"name": "m3.2xlarge.8 by T-Systems Open Telekom Cloud",
"color": "#d1006c",
"data": [
{
"x": 885.1575161456177,
"y": 6599.017946503687
},
{
"x": 876.8247499372769,
"y": 6594.182922390099
},
{
"x": 884.3589250521754,
"y": 6600.965911793177
},
{
"x": 889.0351412956704,
"y": 6525.612868467162
},
{
"x": 886.4551298859614,
"y": 6591.723397891856
},
{
"x": 890.8390704141751,
"y": 6421.293641291071
},
{
"x": 892.9253497227764,
"y": 6642.1556974658915
},
{
"x": 902.1621246852676,
"y": 4921.115057084578
},
{
"x": 863.1794595645056,
"y": 6346.427895037965
},
{
"x": 912.1681465596236,
"y": 5824.246026823388
},
{
"x": 890.6888233637887,
"y": 6510.751617032325
},
{
"x": 880.4042853856383,
"y": 6235.001724722468
},
{
"x": 894.6847961027357,
"y": 6448.740389225837
},
{
"x": 910.2255038156553,
"y": 5701.034074506399
},
{
"x": 889.0898999368246,
"y": 6481.299923032151
},
{
"x": 891.0137818401377,
"y": 5002.548076004478
},
{
"x": 893.1551841612539,
"y": 6565.883868668907
},
{
"x": 907.5240053731659,
"y": 4764.723184530115
},
{
"x": 886.9738620344173,
"y": 6530.006932741809
},
{
"x": 875.9819680393452,
"y": 4450.695591653184
},
{
"x": 894.9385603596035,
"y": 6579.062200328152
},
{
"x": 893.0960353081915,
"y": 5913.41080617322
},
{
"x": 897.9576387813213,
"y": 6669.920023288243
},
{
"x": 904.0838464094657,
"y": 6114.6138722065825
},
{
"x": 891.8699835966028,
"y": 6598.830549674718
},
{
"x": 896.4549612192166,
"y": 5546.42329277283
}
]
}
],
"drilldown": {},
"tooltip": {
"enabled": true,
"useHTML": false,
"format": null,
"headerFormat": "",
"pointFormat": "<span style=\"color:{series.color}\">Single</span>: <b>{point.x:.0f}</b><br><span style=\"color:{series.color}\">Multi</span>: <b>{point.y:.0f}</b>",
"footerFormat": "",
"shared": false,
"outside": false,
"valueDecimals": null,
"split": false
},
"annotations": null
},
"hc_type": "chart",
"id": "80819933321166144025617692406646612826"
}
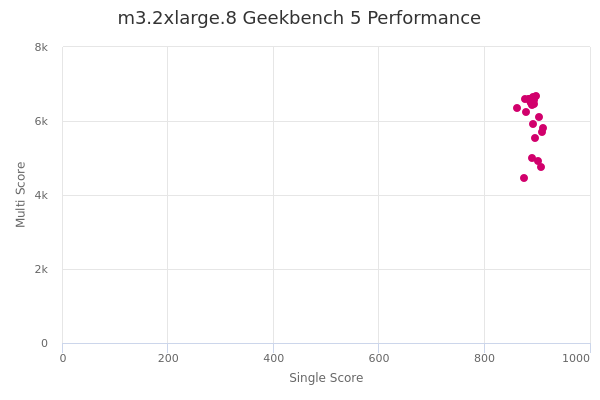
| Single | Multi | |
|---|---|---|
| Max | 912 | 6670 |
| Average | 892 | 6122 |
| Deviation | 10.62 | 648.82 |
| Min | 863 | 4451 |
Sign up as Freemium to get more insight.
- In same series
- m3.medium.8
- m3.large.8
- m3.xlarge.8
- m3.2xlarge.8
- m3.4xlarge.8
- m3.8xlarge.8
- m3.15xlarge.8