m2.8xlarge.8 by T-Systems Open Telekom Cloud
Geekbench is a cross-platform processor benchmark with a scoring system that determines single-core and multi-core performance using loads simulating real-world scenarios. Geekbench 5 score is calculated with a reference score of 2500 representing the performance of the Intel Core i5-2520M @ 2.50 GHz. The software benchmark is available for Mac OS, Windows, Linux, Android and iOS platforms.
Specifications:
CPU
32
RAM
256.0 GB
{
"configuration": {
"chart": {
"type": "scatter",
"polar": false,
"zoomType": "",
"options3d": {},
"height": null,
"width": null,
"margin": null,
"inverted": false,
"zooming": {}
},
"credits": {
"enabled": false
},
"title": {
"text": ""
},
"colorAxis": null,
"subtitle": {
"text": ""
},
"xAxis": {
"title": {
"text": [
"Single Score"
],
"useHTML": false,
"style": {
"color": "#666666"
}
},
"categories": null,
"lineWidth": 1,
"tickInterval": null,
"tickWidth": 1,
"tickLength": 10,
"tickPixelInterval": 100,
"plotLines": null,
"labels": {
"enabled": true,
"format": null,
"formatter": "",
"style": {
"color": "#666666",
"cursor": "default",
"fontSize": "11px"
},
"useHTML": false,
"step": 0
},
"plotBands": null,
"visible": true,
"floor": null,
"ceiling": null,
"type": "linear",
"min": 0,
"gridLineWidth": 1,
"gridLineColor": "#e6e6e6",
"minorTickInterval": null,
"minorTickWidth": 0,
"minTickInterval": null,
"startOnTick": true,
"endOnTick": true,
"tickmarkPlacement": 100,
"units": 100,
"minRange": 100
},
"yAxis": {
"title": {
"text": [
"Multi Score"
],
"useHTML": false,
"style": {
"color": "#666666"
}
},
"categories": null,
"plotLines": null,
"plotBands": null,
"lineWidth": null,
"tickInterval": null,
"tickLength": 10,
"floor": null,
"ceiling": null,
"gridLineInterpolation": null,
"gridLineWidth": 1,
"gridLineColor": "#e6e6e6",
"min": 0,
"max": null,
"minorTickInterval": null,
"minorTickWidth": 0,
"minTickInterval": null,
"startOnTick": true,
"endOnTick": true,
"minRange": null,
"type": "linear",
"tickmarkPlacement": null,
"labels": {
"enabled": true,
"formatter": null,
"style": {
"color": "#666666",
"cursor": "default",
"fontSize": "11px"
},
"useHTML": false
}
},
"zAxis": {
"title": {
"text": "Multi Score"
}
},
"plotOptions": {
"series": {
"dataLabels": {
"enabled": false,
"format": null,
"distance": 30,
"align": "center",
"inside": null,
"allowOverlap": false,
"style": {
"fontSize": "11px"
}
},
"showInLegend": null,
"turboThreshold": 0,
"stacking": "",
"groupPadding": 0.2,
"centerInCategory": false,
"findNearestPointBy": "x"
}
},
"navigator": {
"enabled": false
},
"scrollbar": {
"enabled": false
},
"rangeSelector": {
"enabled": false,
"inputEnabled": false
},
"legend": {
"enabled": null,
"maxHeight": null,
"align": "center",
"verticalAlign": "bottom",
"layout": "horizontal",
"width": null,
"margin": 12,
"reversed": false
},
"series": [
{
"name": "m2.8xlarge.8 by T-Systems Open Telekom Cloud",
"color": "#d1006c",
"data": [
{
"x": 831.1556875702599,
"y": 12099.11945652384
},
{
"x": 832.4577148598673,
"y": 12022.701982764465
},
{
"x": 831.2617405774919,
"y": 11935.395231195234
},
{
"x": 834.0700678123771,
"y": 12246.689940430853
},
{
"x": 834.8981077413468,
"y": 12236.240823752876
},
{
"x": 861.4273416749872,
"y": 12772.784908418642
},
{
"x": 854.4364805425074,
"y": 12691.447294240488
},
{
"x": 851.7214583353475,
"y": 12748.587747706082
},
{
"x": 849.3652801599701,
"y": 12841.607503659878
},
{
"x": 853.3212494485242,
"y": 12752.278824882364
},
{
"x": 849.7324031719241,
"y": 13061.371323640262
},
{
"x": 850.4856346530522,
"y": 13102.723254305874
},
{
"x": 849.5505830496079,
"y": 12721.954688001919
},
{
"x": 849.1774188867375,
"y": 12742.668377461241
},
{
"x": 849.935623244965,
"y": 12609.297870739116
},
{
"x": 852.1562046682693,
"y": 12866.007523955397
},
{
"x": 852.7773333544603,
"y": 12820.52083939554
},
{
"x": 855.4541994012827,
"y": 12785.442507470489
},
{
"x": 857.7946736740938,
"y": 13030.344415818698
},
{
"x": 853.0663107379255,
"y": 12838.594926606223
},
{
"x": 852.4989809259827,
"y": 12547.955508074205
},
{
"x": 854.3367487760465,
"y": 12614.17152104361
},
{
"x": 850.8534044746611,
"y": 13003.484172130095
},
{
"x": 857.0270923497862,
"y": 12935.144501946492
},
{
"x": 855.0692066893328,
"y": 12808.19652543892
}
]
}
],
"drilldown": {},
"tooltip": {
"enabled": true,
"useHTML": false,
"format": null,
"headerFormat": "",
"pointFormat": "<span style=\"color:{series.color}\">Single</span>: <b>{point.x:.0f}</b><br><span style=\"color:{series.color}\">Multi</span>: <b>{point.y:.0f}</b>",
"footerFormat": "",
"shared": false,
"outside": false,
"valueDecimals": null,
"split": false
},
"annotations": null
},
"hc_type": "chart",
"id": "69752372099094273514807969112761464407"
}
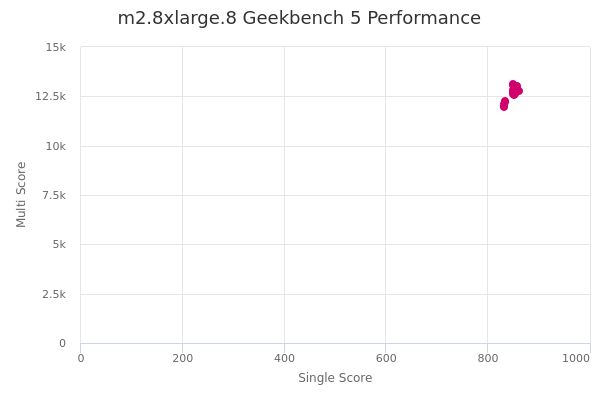
| Single | Multi | |
|---|---|---|
| Max | 861 | 13103 |
| Average | 849 | 12673 |
| Deviation | 8.60 | 316.76 |
| Min | 831 | 11935 |
Sign up as Freemium to get more insight.
- In same series
- m2.4xlarge.8
- m2.8xlarge.8