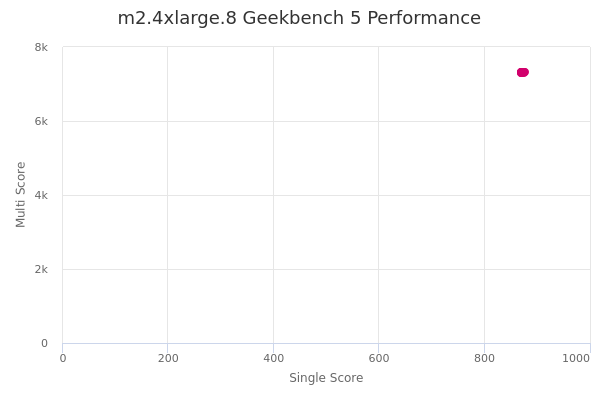
m2.4xlarge.8 by T-Systems Open Telekom Cloud
Geekbench is a cross-platform processor benchmark with a scoring system that determines single-core and multi-core performance using loads simulating real-world scenarios. Geekbench 5 score is calculated with a reference score of 2500 representing the performance of the Intel Core i5-2520M @ 2.50 GHz. The software benchmark is available for Mac OS, Windows, Linux, Android and iOS platforms.
Specifications:
CPU
16
RAM
128.0 GB
{
"configuration": {
"chart": {
"type": "scatter",
"polar": false,
"zoomType": "",
"options3d": {},
"height": null,
"width": null,
"margin": null,
"inverted": false,
"zooming": {}
},
"credits": {
"enabled": false
},
"title": {
"text": ""
},
"colorAxis": null,
"subtitle": {
"text": ""
},
"xAxis": {
"title": {
"text": [
"Single Score"
],
"useHTML": false,
"style": {
"color": "#666666"
}
},
"categories": null,
"lineWidth": 1,
"tickInterval": null,
"tickWidth": 1,
"tickLength": 10,
"tickPixelInterval": 100,
"plotLines": null,
"labels": {
"enabled": true,
"format": null,
"formatter": "",
"style": {
"color": "#666666",
"cursor": "default",
"fontSize": "11px"
},
"useHTML": false,
"step": 0
},
"plotBands": null,
"visible": true,
"floor": null,
"ceiling": null,
"type": "linear",
"min": 0,
"gridLineWidth": 1,
"gridLineColor": "#e6e6e6",
"minorTickInterval": null,
"minorTickWidth": 0,
"minTickInterval": null,
"startOnTick": true,
"endOnTick": true,
"tickmarkPlacement": 100,
"units": 100,
"minRange": 100
},
"yAxis": {
"title": {
"text": [
"Multi Score"
],
"useHTML": false,
"style": {
"color": "#666666"
}
},
"categories": null,
"plotLines": null,
"plotBands": null,
"lineWidth": null,
"tickInterval": null,
"tickLength": 10,
"floor": null,
"ceiling": null,
"gridLineInterpolation": null,
"gridLineWidth": 1,
"gridLineColor": "#e6e6e6",
"min": 0,
"max": null,
"minorTickInterval": null,
"minorTickWidth": 0,
"minTickInterval": null,
"startOnTick": true,
"endOnTick": true,
"minRange": null,
"type": "linear",
"tickmarkPlacement": null,
"labels": {
"enabled": true,
"formatter": null,
"style": {
"color": "#666666",
"cursor": "default",
"fontSize": "11px"
},
"useHTML": false
}
},
"zAxis": {
"title": {
"text": "Multi Score"
}
},
"plotOptions": {
"series": {
"dataLabels": {
"enabled": false,
"format": null,
"distance": 30,
"align": "center",
"inside": null,
"allowOverlap": false,
"style": {
"fontSize": "11px"
}
},
"showInLegend": null,
"turboThreshold": 0,
"stacking": "",
"groupPadding": 0.2,
"centerInCategory": false,
"findNearestPointBy": "x"
}
},
"navigator": {
"enabled": false
},
"scrollbar": {
"enabled": false
},
"rangeSelector": {
"enabled": false,
"inputEnabled": false
},
"legend": {
"enabled": null,
"maxHeight": null,
"align": "center",
"verticalAlign": "bottom",
"layout": "horizontal",
"width": null,
"margin": 12,
"reversed": false
},
"series": [
{
"name": "m2.4xlarge.8 by T-Systems Open Telekom Cloud",
"color": "#d1006c",
"data": [
{
"x": 875.8375665730449,
"y": 7336.067109003057
},
{
"x": 874.1962274769451,
"y": 7318.52514016645
},
{
"x": 875.2568293537311,
"y": 7333.842015955053
},
{
"x": 870.8536943376225,
"y": 7326.763528715841
},
{
"x": 878.1660054327177,
"y": 7324.707272808675
},
{
"x": 871.506221563357,
"y": 7316.597536840525
},
{
"x": 872.6187962805138,
"y": 7291.3729250026645
},
{
"x": 870.4724204416802,
"y": 7299.010589142715
},
{
"x": 872.0114479221943,
"y": 7290.4914990595025
},
{
"x": 875.8138910789976,
"y": 7307.199628222621
},
{
"x": 871.1888875457096,
"y": 7320.704728369294
},
{
"x": 872.7494605445984,
"y": 7315.919342717452
},
{
"x": 872.9777508981596,
"y": 7315.864479317837
},
{
"x": 870.0425498783483,
"y": 7315.347847308196
},
{
"x": 870.4623586547125,
"y": 7316.554824467626
},
{
"x": 871.0883812545321,
"y": 7326.090512654
},
{
"x": 875.1790682789214,
"y": 7318.796289452859
},
{
"x": 871.1986106293132,
"y": 7319.713603836819
},
{
"x": 874.8340902138979,
"y": 7315.672262102531
},
{
"x": 870.1586161472981,
"y": 7291.384757624994
}
]
}
],
"drilldown": {},
"tooltip": {
"enabled": true,
"useHTML": false,
"format": null,
"headerFormat": "",
"pointFormat": "<span style=\"color:{series.color}\">Single</span>: <b>{point.x:.0f}</b><br><span style=\"color:{series.color}\">Multi</span>: <b>{point.y:.0f}</b>",
"footerFormat": "",
"shared": false,
"outside": false,
"valueDecimals": null,
"split": false
},
"annotations": null
},
"hc_type": "chart",
"id": "235640596708699401852592428337588186436"
}
| Single | Multi | |
|---|---|---|
| Max | 878 | 7336 |
| Average | 873 | 7315 |
| Deviation | 2.29 | 12.80 |
| Min | 870 | 7290 |
Sign up as Freemium to get more insight.
- In same series
- m2.4xlarge.8
- m2.8xlarge.8