START1-XS by Scaleway
Geekbench is a cross-platform processor benchmark with a scoring system that determines single-core and multi-core performance using loads simulating real-world scenarios. Geekbench 5 score is calculated with a reference score of 2500 representing the performance of the Intel Core i5-2520M @ 2.50 GHz. The software benchmark is available for Mac OS, Windows, Linux, Android and iOS platforms.
Specifications:
CPU
1
RAM
1.0 GB
Net
100 Mbps
{
"configuration": {
"chart": {
"type": "scatter",
"polar": false,
"zoomType": "",
"options3d": {},
"height": null,
"width": null,
"margin": null,
"inverted": false,
"zooming": {}
},
"credits": {
"enabled": false
},
"title": {
"text": ""
},
"colorAxis": null,
"subtitle": {
"text": ""
},
"xAxis": {
"title": {
"text": [
"Single Score"
],
"useHTML": false,
"style": {
"color": "#666666"
}
},
"categories": null,
"lineWidth": 1,
"tickInterval": null,
"tickWidth": 1,
"tickLength": 10,
"tickPixelInterval": 100,
"plotLines": null,
"labels": {
"enabled": true,
"format": null,
"formatter": "",
"style": {
"color": "#666666",
"cursor": "default",
"fontSize": "11px"
},
"useHTML": false,
"step": 0
},
"plotBands": null,
"visible": true,
"floor": null,
"ceiling": null,
"type": "linear",
"min": 0,
"gridLineWidth": 1,
"gridLineColor": "#e6e6e6",
"minorTickInterval": null,
"minorTickWidth": 0,
"minTickInterval": null,
"startOnTick": true,
"endOnTick": true,
"tickmarkPlacement": 100,
"units": 100,
"minRange": 100
},
"yAxis": {
"title": {
"text": [
"Multi Score"
],
"useHTML": false,
"style": {
"color": "#666666"
}
},
"categories": null,
"plotLines": null,
"plotBands": null,
"lineWidth": null,
"tickInterval": null,
"tickLength": 10,
"floor": null,
"ceiling": null,
"gridLineInterpolation": null,
"gridLineWidth": 1,
"gridLineColor": "#e6e6e6",
"min": 0,
"max": null,
"minorTickInterval": null,
"minorTickWidth": 0,
"minTickInterval": null,
"startOnTick": true,
"endOnTick": true,
"minRange": null,
"type": "linear",
"tickmarkPlacement": null,
"labels": {
"enabled": true,
"formatter": null,
"style": {
"color": "#666666",
"cursor": "default",
"fontSize": "11px"
},
"useHTML": false
}
},
"zAxis": {
"title": {
"text": "Multi Score"
}
},
"plotOptions": {
"series": {
"dataLabels": {
"enabled": false,
"format": null,
"distance": 30,
"align": "center",
"inside": null,
"allowOverlap": false,
"style": {
"fontSize": "11px"
}
},
"showInLegend": null,
"turboThreshold": 0,
"stacking": "",
"groupPadding": 0.2,
"centerInCategory": false,
"findNearestPointBy": "x"
}
},
"navigator": {
"enabled": false
},
"scrollbar": {
"enabled": false
},
"rangeSelector": {
"enabled": false,
"inputEnabled": false
},
"legend": {
"enabled": null,
"maxHeight": null,
"align": "center",
"verticalAlign": "bottom",
"layout": "horizontal",
"width": null,
"margin": 12,
"reversed": false
},
"series": [
{
"name": "START1-XS by Scaleway",
"color": "#510099",
"data": [
{
"x": 586.9563590351513,
"y": 583.665249016207
},
{
"x": 577.9357795541058,
"y": 574.7379388089539
},
{
"x": 558.9490425583926,
"y": 551.8500647338903
},
{
"x": 571.691264628579,
"y": 551.2475638363215
},
{
"x": 565.6787815227112,
"y": 562.0524012990647
},
{
"x": 567.9022018671914,
"y": 575.9696902216185
},
{
"x": 826.8823640256674,
"y": 826.4653269715091
},
{
"x": 480.47736410180016,
"y": 474.8160905366698
},
{
"x": 839.541026463319,
"y": 844.1475798808746
},
{
"x": 590.7292122916703,
"y": 580.3849902490928
},
{
"x": 573.1006569143506,
"y": 566.8256211323526
},
{
"x": 847.552854528144,
"y": 849.1740671745404
},
{
"x": 472.68416737327055,
"y": 464.8889695251007
},
{
"x": 569.5095121195675,
"y": 577.5127749174407
},
{
"x": 546.6604552292597,
"y": 567.8793969899267
},
{
"x": 834.7321256770808,
"y": 829.7654206933694
},
{
"x": 471.8147186920561,
"y": 468.5887367698977
},
{
"x": 576.0206027471536,
"y": 571.288962919867
},
{
"x": 827.361167475762,
"y": 819.2224964728132
},
{
"x": 567.8992331552538,
"y": 552.7941695658377
},
{
"x": 824.7965732928657,
"y": 837.0077942821823
},
{
"x": 575.0291590059123,
"y": 589.4591881684934
},
{
"x": 452.78513899609095,
"y": 453.406977085776
},
{
"x": 561.195762281196,
"y": 551.6068113965064
},
{
"x": 831.2947650219706,
"y": 824.8671208002304
},
{
"x": 587.4266777198253,
"y": 573.2051059378598
},
{
"x": 556.33905717757,
"y": 573.2900539369782
},
{
"x": 854.3385638658337,
"y": 837.398128450466
},
{
"x": 474.68634644465106,
"y": 450.188790255952
},
{
"x": 590.5171286124314,
"y": 586.3265660819002
},
{
"x": 854.0655729669411,
"y": 847.0090724042658
},
{
"x": 592.6981538594215,
"y": 571.0236915467641
},
{
"x": 460.8097114261185,
"y": 466.38147410143256
},
{
"x": 842.0161322308277,
"y": 836.1828088215157
},
{
"x": 578.186474535313,
"y": 579.761137930512
},
{
"x": 561.2678206101407,
"y": 545.231868636423
},
{
"x": 463.12969429182436,
"y": 465.21216804528797
},
{
"x": 468.38006829552455,
"y": 461.46288090007897
},
{
"x": 473.77296693735633,
"y": 476.5188031357724
},
{
"x": 489.61093883725187,
"y": 474.1535947981597
}
]
}
],
"drilldown": {},
"tooltip": {
"enabled": true,
"useHTML": false,
"format": null,
"headerFormat": "",
"pointFormat": "<span style=\"color:{series.color}\">Single</span>: <b>{point.x:.0f}</b><br><span style=\"color:{series.color}\">Multi</span>: <b>{point.y:.0f}</b>",
"footerFormat": "",
"shared": false,
"outside": false,
"valueDecimals": null,
"split": false
},
"annotations": null
},
"hc_type": "chart",
"id": "74125407615302764126210453486332207155"
}
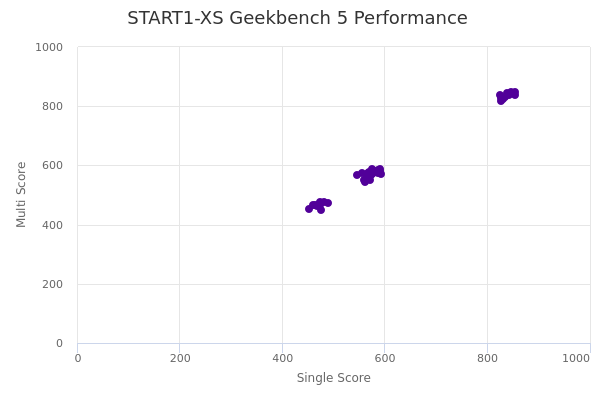
| Single | Multi | |
|---|---|---|
| Max | 854 | 849 |
| Average | 614 | 610 |
| Deviation | 136.66 | 137.23 |
| Min | 453 | 450 |