PRO2-M by Scaleway
Geekbench is a cross-platform processor benchmark with a scoring system that determines single-core and multi-core performance using loads simulating real-world scenarios. Geekbench 5 score is calculated with a reference score of 2500 representing the performance of the Intel Core i5-2520M @ 2.50 GHz. The software benchmark is available for Mac OS, Windows, Linux, Android and iOS platforms.
Specifications:
CPU
16
RAM
64.0 GB
Net
2861 Mbps
{
"configuration": {
"chart": {
"type": "scatter",
"polar": false,
"zoomType": "",
"options3d": {},
"height": null,
"width": null,
"margin": null,
"inverted": false,
"zooming": {}
},
"credits": {
"enabled": false
},
"title": {
"text": ""
},
"colorAxis": null,
"subtitle": {
"text": ""
},
"xAxis": {
"title": {
"text": [
"Single Score"
],
"useHTML": false,
"style": {
"color": "#666666"
}
},
"categories": null,
"lineWidth": 1,
"tickInterval": null,
"tickWidth": 1,
"tickLength": 10,
"tickPixelInterval": 100,
"plotLines": null,
"labels": {
"enabled": true,
"format": null,
"formatter": "",
"style": {
"color": "#666666",
"cursor": "default",
"fontSize": "11px"
},
"useHTML": false,
"step": 0
},
"plotBands": null,
"visible": true,
"floor": null,
"ceiling": null,
"type": "linear",
"min": 0,
"gridLineWidth": 1,
"gridLineColor": "#e6e6e6",
"minorTickInterval": null,
"minorTickWidth": 0,
"minTickInterval": null,
"startOnTick": true,
"endOnTick": true,
"tickmarkPlacement": 100,
"units": 100,
"minRange": 100
},
"yAxis": {
"title": {
"text": [
"Multi Score"
],
"useHTML": false,
"style": {
"color": "#666666"
}
},
"categories": null,
"plotLines": null,
"plotBands": null,
"lineWidth": null,
"tickInterval": null,
"tickLength": 10,
"floor": null,
"ceiling": null,
"gridLineInterpolation": null,
"gridLineWidth": 1,
"gridLineColor": "#e6e6e6",
"min": 0,
"max": null,
"minorTickInterval": null,
"minorTickWidth": 0,
"minTickInterval": null,
"startOnTick": true,
"endOnTick": true,
"minRange": null,
"type": "linear",
"tickmarkPlacement": null,
"labels": {
"enabled": true,
"formatter": null,
"style": {
"color": "#666666",
"cursor": "default",
"fontSize": "11px"
},
"useHTML": false
}
},
"zAxis": {
"title": {
"text": "Multi Score"
}
},
"plotOptions": {
"series": {
"dataLabels": {
"enabled": false,
"format": null,
"distance": 30,
"align": "center",
"inside": null,
"allowOverlap": false,
"style": {
"fontSize": "11px"
}
},
"showInLegend": null,
"turboThreshold": 0,
"stacking": "",
"groupPadding": 0.2,
"centerInCategory": false,
"findNearestPointBy": "x"
}
},
"navigator": {
"enabled": false
},
"scrollbar": {
"enabled": false
},
"rangeSelector": {
"enabled": false,
"inputEnabled": false
},
"legend": {
"enabled": null,
"maxHeight": null,
"align": "center",
"verticalAlign": "bottom",
"layout": "horizontal",
"width": null,
"margin": 12,
"reversed": false
},
"series": [
{
"name": "PRO2-M by Scaleway",
"color": "#510099",
"data": [
{
"x": 1158.960767842759,
"y": 12067.511792013553
},
{
"x": 1152.3264917279912,
"y": 12336.280071713907
},
{
"x": 1137.865018756647,
"y": 12573.433354881874
},
{
"x": 1085.5404261030505,
"y": 12622.335678064068
},
{
"x": 1132.7326204438318,
"y": 12401.069442995518
},
{
"x": 1119.890985894192,
"y": 12900.460193045263
},
{
"x": 1119.2269658221921,
"y": 12429.684200624903
},
{
"x": 1116.2324326875416,
"y": 12618.918676652636
},
{
"x": 1108.4191649252186,
"y": 12579.03828635869
},
{
"x": 1112.7789276236415,
"y": 12568.627497401285
},
{
"x": 1117.6572130605964,
"y": 12551.527393765406
},
{
"x": 1109.3588572020415,
"y": 12500.095797105025
},
{
"x": 1116.4700794346559,
"y": 12543.374650867092
},
{
"x": 1070.4884898016064,
"y": 12420.588905556802
},
{
"x": 1143.8505331891788,
"y": 12439.732101544902
},
{
"x": 1084.7335899782606,
"y": 12478.285487269284
},
{
"x": 1132.3848651644098,
"y": 12536.558402777198
},
{
"x": 1065.7728873021344,
"y": 12673.909951085725
},
{
"x": 1152.3623880215787,
"y": 12706.83093335935
},
{
"x": 1053.549165863781,
"y": 13093.814799326392
},
{
"x": 1281.4598889039457,
"y": 15545.275436052905
},
{
"x": 1192.290591701216,
"y": 13838.440376137823
},
{
"x": 1164.5359411416366,
"y": 15238.788637242775
},
{
"x": 1213.0956614861193,
"y": 14449.531283567154
},
{
"x": 1198.8966984371425,
"y": 15104.265224562761
},
{
"x": 1184.8181090600797,
"y": 14042.79612746644
}
]
}
],
"drilldown": {},
"tooltip": {
"enabled": true,
"useHTML": false,
"format": null,
"headerFormat": "",
"pointFormat": "<span style=\"color:{series.color}\">Single</span>: <b>{point.x:.0f}</b><br><span style=\"color:{series.color}\">Multi</span>: <b>{point.y:.0f}</b>",
"footerFormat": "",
"shared": false,
"outside": false,
"valueDecimals": null,
"split": false
},
"annotations": null
},
"hc_type": "chart",
"id": "301797992735990628884289389869384216302"
}
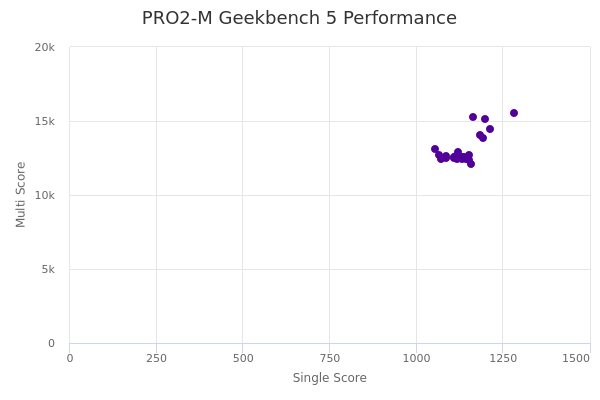
| Single | Multi | |
|---|---|---|
| Max | 1281 | 15545 |
| Average | 1136 | 13049 |
| Deviation | 49.39 | 972.37 |
| Min | 1054 | 12068 |