DEV1-M by Scaleway
Geekbench is a cross-platform processor benchmark with a scoring system that determines single-core and multi-core performance using loads simulating real-world scenarios. Geekbench 5 score is calculated with a reference score of 2500 representing the performance of the Intel Core i5-2520M @ 2.50 GHz. The software benchmark is available for Mac OS, Windows, Linux, Android and iOS platforms.
Specifications:
CPU
3
RAM
4.0 GB
Net
286 Mbps
{
"configuration": {
"chart": {
"type": "scatter",
"polar": false,
"zoomType": "",
"options3d": {},
"height": null,
"width": null,
"margin": null,
"inverted": false,
"zooming": {}
},
"credits": {
"enabled": false
},
"title": {
"text": ""
},
"colorAxis": null,
"subtitle": {
"text": ""
},
"xAxis": {
"title": {
"text": [
"Single Score"
],
"useHTML": false,
"style": {
"color": "#666666"
}
},
"categories": null,
"lineWidth": 1,
"tickInterval": null,
"tickWidth": 1,
"tickLength": 10,
"tickPixelInterval": 100,
"plotLines": null,
"labels": {
"enabled": true,
"format": null,
"formatter": "",
"style": {
"color": "#666666",
"cursor": "default",
"fontSize": "11px"
},
"useHTML": false,
"step": 0
},
"plotBands": null,
"visible": true,
"floor": null,
"ceiling": null,
"type": "linear",
"min": 0,
"gridLineWidth": 1,
"gridLineColor": "#e6e6e6",
"minorTickInterval": null,
"minorTickWidth": 0,
"minTickInterval": null,
"startOnTick": true,
"endOnTick": true,
"tickmarkPlacement": 100,
"units": 100,
"minRange": 100
},
"yAxis": {
"title": {
"text": [
"Multi Score"
],
"useHTML": false,
"style": {
"color": "#666666"
}
},
"categories": null,
"plotLines": null,
"plotBands": null,
"lineWidth": null,
"tickInterval": null,
"tickLength": 10,
"floor": null,
"ceiling": null,
"gridLineInterpolation": null,
"gridLineWidth": 1,
"gridLineColor": "#e6e6e6",
"min": 0,
"max": null,
"minorTickInterval": null,
"minorTickWidth": 0,
"minTickInterval": null,
"startOnTick": true,
"endOnTick": true,
"minRange": null,
"type": "linear",
"tickmarkPlacement": null,
"labels": {
"enabled": true,
"formatter": null,
"style": {
"color": "#666666",
"cursor": "default",
"fontSize": "11px"
},
"useHTML": false
}
},
"zAxis": {
"title": {
"text": "Multi Score"
}
},
"plotOptions": {
"series": {
"dataLabels": {
"enabled": false,
"format": null,
"distance": 30,
"align": "center",
"inside": null,
"allowOverlap": false,
"style": {
"fontSize": "11px"
}
},
"showInLegend": null,
"turboThreshold": 0,
"stacking": "",
"groupPadding": 0.2,
"centerInCategory": false,
"findNearestPointBy": "x"
}
},
"navigator": {
"enabled": false
},
"scrollbar": {
"enabled": false
},
"rangeSelector": {
"enabled": false,
"inputEnabled": false
},
"legend": {
"enabled": null,
"maxHeight": null,
"align": "center",
"verticalAlign": "bottom",
"layout": "horizontal",
"width": null,
"margin": 12,
"reversed": false
},
"series": [
{
"name": "DEV1-M by Scaleway",
"color": "#510099",
"data": [
{
"x": 462.5314042130501,
"y": 1250.9271230936197
},
{
"x": 433.6287621735825,
"y": 1274.9708917488185
},
{
"x": 474.03851319667376,
"y": 1243.8721808886837
},
{
"x": 448.53765251608894,
"y": 1199.0852683183534
},
{
"x": 450.81938360413926,
"y": 1209.9916847735162
},
{
"x": 511.31704398121326,
"y": 1373.4251116351115
},
{
"x": 458.74130726375745,
"y": 1185.560907779202
},
{
"x": 523.9932937401713,
"y": 1391.8853833907533
},
{
"x": 456.20251905236705,
"y": 1193.480977317854
},
{
"x": 508.15833478555294,
"y": 1358.709664822583
},
{
"x": 460.8916961372345,
"y": 1206.3850906734044
},
{
"x": 520.7173058417958,
"y": 1396.8101890481094
},
{
"x": 443.4872265539043,
"y": 1204.8185332930684
},
{
"x": 518.9139927632528,
"y": 1420.199208567954
},
{
"x": 455.9822745198172,
"y": 1176.3731094823977
},
{
"x": 507.3235391677135,
"y": 1380.388501529757
},
{
"x": 451.69291444308385,
"y": 1205.2470361118158
},
{
"x": 512.3504173142405,
"y": 1417.783497747223
},
{
"x": 457.76283230303443,
"y": 1146.083378876283
},
{
"x": 505.94445979839577,
"y": 1373.7072755012744
},
{
"x": 463.4699299613802,
"y": 1152.5916405892826
},
{
"x": 507.777489939681,
"y": 1373.3378994406892
},
{
"x": 511.0590909752516,
"y": 1376.8009450247648
},
{
"x": 444.0347963022765,
"y": 1204.9860424181966
},
{
"x": 481.5134421472237,
"y": 1257.1713259913072
}
]
}
],
"drilldown": {},
"tooltip": {
"enabled": true,
"useHTML": false,
"format": null,
"headerFormat": "",
"pointFormat": "<span style=\"color:{series.color}\">Single</span>: <b>{point.x:.0f}</b><br><span style=\"color:{series.color}\">Multi</span>: <b>{point.y:.0f}</b>",
"footerFormat": "",
"shared": false,
"outside": false,
"valueDecimals": null,
"split": false
},
"annotations": null
},
"hc_type": "chart",
"id": "44296874563681157450550664346147341984"
}
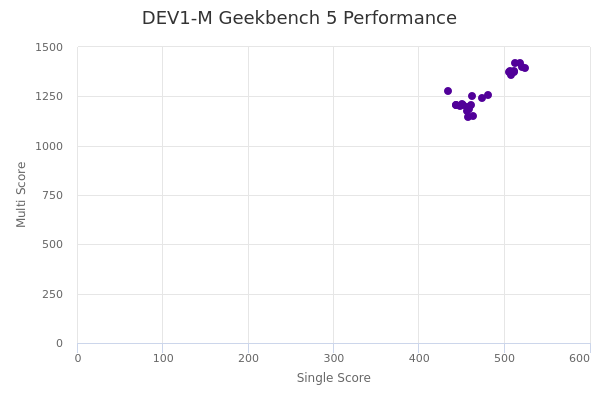
| Single | Multi | |
|---|---|---|
| Max | 524 | 1420 |
| Average | 479 | 1279 |
| Deviation | 29.35 | 92.60 |
| Min | 434 | 1146 |