BM-M1 by OVHcloud
Geekbench is a cross-platform processor benchmark with a scoring system that determines single-core and multi-core performance using loads simulating real-world scenarios. Geekbench 5 score is calculated with a reference score of 2500 representing the performance of the Intel Core i5-2520M @ 2.50 GHz. The software benchmark is available for Mac OS, Windows, Linux, Android and iOS platforms.
Specifications:
CPU
16
RAM
62.5 GB
Root
960 GB
BM-S1 SSD
Extra
1x
960 GB
NVMe SSD
{
"configuration": {
"chart": {
"type": "scatter",
"polar": false,
"zoomType": "",
"options3d": {},
"height": null,
"width": null,
"margin": null,
"inverted": false,
"zooming": {}
},
"credits": {
"enabled": false
},
"title": {
"text": ""
},
"colorAxis": null,
"subtitle": {
"text": ""
},
"xAxis": {
"title": {
"text": [
"Single Score"
],
"useHTML": false,
"style": {
"color": "#666666"
}
},
"categories": null,
"lineWidth": 1,
"tickInterval": null,
"tickWidth": 1,
"tickLength": 10,
"tickPixelInterval": 100,
"plotLines": null,
"labels": {
"enabled": true,
"format": null,
"formatter": "",
"style": {
"color": "#666666",
"cursor": "default",
"fontSize": "11px"
},
"useHTML": false,
"step": 0
},
"plotBands": null,
"visible": true,
"floor": null,
"ceiling": null,
"type": "linear",
"min": 0,
"gridLineWidth": 1,
"gridLineColor": "#e6e6e6",
"minorTickInterval": null,
"minorTickWidth": 0,
"minTickInterval": null,
"startOnTick": true,
"endOnTick": true,
"tickmarkPlacement": 100,
"units": 100,
"minRange": 100
},
"yAxis": {
"title": {
"text": [
"Multi Score"
],
"useHTML": false,
"style": {
"color": "#666666"
}
},
"categories": null,
"plotLines": null,
"plotBands": null,
"lineWidth": null,
"tickInterval": null,
"tickLength": 10,
"floor": null,
"ceiling": null,
"gridLineInterpolation": null,
"gridLineWidth": 1,
"gridLineColor": "#e6e6e6",
"min": 0,
"max": null,
"minorTickInterval": null,
"minorTickWidth": 0,
"minTickInterval": null,
"startOnTick": true,
"endOnTick": true,
"minRange": null,
"type": "linear",
"tickmarkPlacement": null,
"labels": {
"enabled": true,
"formatter": null,
"style": {
"color": "#666666",
"cursor": "default",
"fontSize": "11px"
},
"useHTML": false
}
},
"zAxis": {
"title": {
"text": "Multi Score"
}
},
"plotOptions": {
"series": {
"dataLabels": {
"enabled": false,
"format": null,
"distance": 30,
"align": "center",
"inside": null,
"allowOverlap": false,
"style": {
"fontSize": "11px"
}
},
"showInLegend": null,
"turboThreshold": 0,
"stacking": "",
"groupPadding": 0.2,
"centerInCategory": false,
"findNearestPointBy": "x"
}
},
"navigator": {
"enabled": false
},
"scrollbar": {
"enabled": false
},
"rangeSelector": {
"enabled": false,
"inputEnabled": false
},
"legend": {
"enabled": null,
"maxHeight": null,
"align": "center",
"verticalAlign": "bottom",
"layout": "horizontal",
"width": null,
"margin": 12,
"reversed": false
},
"series": [
{
"name": "BM-M1 by OVHcloud",
"color": "#484848",
"data": [
{
"x": 1437.7359166621552,
"y": 8594.284326257468
},
{
"x": 1421.989010489248,
"y": 8604.63416267502
},
{
"x": 1423.0359532402306,
"y": 8590.620148776263
},
{
"x": 1438.8605934027617,
"y": 8592.978142971226
},
{
"x": 1429.4319791514627,
"y": 8596.41507852632
},
{
"x": 1430.3529056089887,
"y": 8614.854198473087
},
{
"x": 1414.1754104018232,
"y": 8613.864245159912
},
{
"x": 1438.0753642855132,
"y": 8624.158165306922
},
{
"x": 1427.1955731079906,
"y": 8596.594632407066
},
{
"x": 1426.4292623929841,
"y": 8632.26795503158
},
{
"x": 1435.2242854226963,
"y": 8608.204639647392
},
{
"x": 1428.5307728507892,
"y": 8627.2836536016
},
{
"x": 1417.2709376326036,
"y": 8594.778329927076
},
{
"x": 1427.7320086079585,
"y": 8593.323957849645
},
{
"x": 1423.8798446602661,
"y": 8592.267773683028
},
{
"x": 1427.5506263609714,
"y": 8603.143689978304
},
{
"x": 1428.8368362348403,
"y": 8611.303445468413
},
{
"x": 1430.098515162543,
"y": 8603.653903188038
},
{
"x": 1420.9039324425462,
"y": 8600.157769344281
},
{
"x": 1425.9222439053574,
"y": 8620.77283981015
},
{
"x": 1429.0165664405727,
"y": 8601.725722669771
},
{
"x": 1426.6883713891475,
"y": 8572.413542384662
},
{
"x": 1431.0370145426027,
"y": 8590.986138184906
},
{
"x": 1420.0674628866593,
"y": 8603.26218048213
},
{
"x": 1427.1595487862355,
"y": 8622.892060952112
},
{
"x": 1424.5069051213484,
"y": 8593.747775845337
},
{
"x": 1413.9453984801548,
"y": 8614.780632286273
},
{
"x": 1422.5402476601673,
"y": 8562.045163485986
},
{
"x": 1414.8689893135825,
"y": 8606.70281779019
},
{
"x": 1424.7394169883996,
"y": 8559.945889444962
},
{
"x": 1424.3707096877297,
"y": 8581.97166552245
},
{
"x": 1427.8328284931727,
"y": 8606.84898677119
},
{
"x": 1422.2676271806345,
"y": 8593.415515695715
},
{
"x": 1416.7206783852916,
"y": 8601.791816646539
},
{
"x": 1423.713184918318,
"y": 8580.97756408213
},
{
"x": 1420.0193469046344,
"y": 8626.321937866138
},
{
"x": 1422.581462675109,
"y": 8582.517449604826
},
{
"x": 1415.0915600019712,
"y": 8614.306565982897
},
{
"x": 1429.0318909674193,
"y": 8591.111033117693
},
{
"x": 1424.5958376580136,
"y": 8578.40056963536
}
]
}
],
"drilldown": {},
"tooltip": {
"enabled": true,
"useHTML": false,
"format": null,
"headerFormat": "",
"pointFormat": "<span style=\"color:{series.color}\">Single</span>: <b>{point.x:.0f}</b><br><span style=\"color:{series.color}\">Multi</span>: <b>{point.y:.0f}</b>",
"footerFormat": "",
"shared": false,
"outside": false,
"valueDecimals": null,
"split": false
},
"annotations": null
},
"hc_type": "chart",
"id": "23749749407139772577752106026343370280"
}
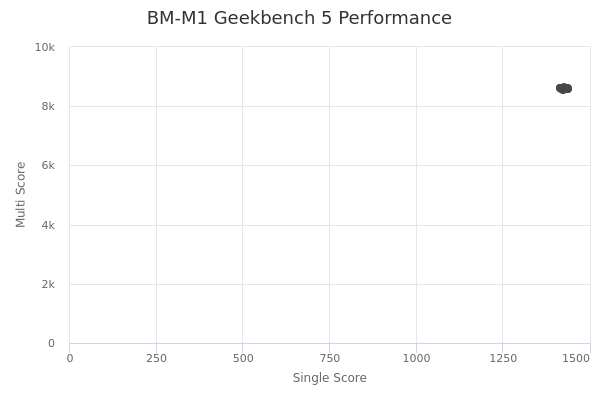
| Single | Multi | |
|---|---|---|
| Max | 1439 | 8632 |
| Average | 1425 | 8600 |
| Deviation | 6.13 | 16.61 |
| Min | 1414 | 8560 |