BM-L1 by OVHcloud
Geekbench is a cross-platform processor benchmark with a scoring system that determines single-core and multi-core performance using loads simulating real-world scenarios. Geekbench 5 score is calculated with a reference score of 2500 representing the performance of the Intel Core i5-2520M @ 2.50 GHz. The software benchmark is available for Mac OS, Windows, Linux, Android and iOS platforms.
Specifications:
CPU
32
RAM
125.0 GB
Root
960 GB
BM-S1 SSD
Extra
1x
960 GB
NVMe SSD
{
"configuration": {
"chart": {
"type": "scatter",
"polar": false,
"zoomType": "",
"options3d": {},
"height": null,
"width": null,
"margin": null,
"inverted": false,
"zooming": {}
},
"credits": {
"enabled": false
},
"title": {
"text": ""
},
"colorAxis": null,
"subtitle": {
"text": ""
},
"xAxis": {
"title": {
"text": [
"Single Score"
],
"useHTML": false,
"style": {
"color": "#666666"
}
},
"categories": null,
"lineWidth": 1,
"tickInterval": null,
"tickWidth": 1,
"tickLength": 10,
"tickPixelInterval": 100,
"plotLines": null,
"labels": {
"enabled": true,
"format": null,
"formatter": "",
"style": {
"color": "#666666",
"cursor": "default",
"fontSize": "11px"
},
"useHTML": false,
"step": 0
},
"plotBands": null,
"visible": true,
"floor": null,
"ceiling": null,
"type": "linear",
"min": 0,
"gridLineWidth": 1,
"gridLineColor": "#e6e6e6",
"minorTickInterval": null,
"minorTickWidth": 0,
"minTickInterval": null,
"startOnTick": true,
"endOnTick": true,
"tickmarkPlacement": 100,
"units": 100,
"minRange": 100
},
"yAxis": {
"title": {
"text": [
"Multi Score"
],
"useHTML": false,
"style": {
"color": "#666666"
}
},
"categories": null,
"plotLines": null,
"plotBands": null,
"lineWidth": null,
"tickInterval": null,
"tickLength": 10,
"floor": null,
"ceiling": null,
"gridLineInterpolation": null,
"gridLineWidth": 1,
"gridLineColor": "#e6e6e6",
"min": 0,
"max": null,
"minorTickInterval": null,
"minorTickWidth": 0,
"minTickInterval": null,
"startOnTick": true,
"endOnTick": true,
"minRange": null,
"type": "linear",
"tickmarkPlacement": null,
"labels": {
"enabled": true,
"formatter": null,
"style": {
"color": "#666666",
"cursor": "default",
"fontSize": "11px"
},
"useHTML": false
}
},
"zAxis": {
"title": {
"text": "Multi Score"
}
},
"plotOptions": {
"series": {
"dataLabels": {
"enabled": false,
"format": null,
"distance": 30,
"align": "center",
"inside": null,
"allowOverlap": false,
"style": {
"fontSize": "11px"
}
},
"showInLegend": null,
"turboThreshold": 0,
"stacking": "",
"groupPadding": 0.2,
"centerInCategory": false,
"findNearestPointBy": "x"
}
},
"navigator": {
"enabled": false
},
"scrollbar": {
"enabled": false
},
"rangeSelector": {
"enabled": false,
"inputEnabled": false
},
"legend": {
"enabled": null,
"maxHeight": null,
"align": "center",
"verticalAlign": "bottom",
"layout": "horizontal",
"width": null,
"margin": 12,
"reversed": false
},
"series": [
{
"name": "BM-L1 by OVHcloud",
"color": "#484848",
"data": [
{
"x": 1056.3989398036383,
"y": 14513.484600288284
},
{
"x": 1047.3379689983856,
"y": 14307.520984927645
},
{
"x": 1056.520284434032,
"y": 14453.05122136055
},
{
"x": 1044.1902095838107,
"y": 14085.555198496411
},
{
"x": 1054.7132702555577,
"y": 14284.026974437365
},
{
"x": 1040.6112453971243,
"y": 14127.885023011211
},
{
"x": 1049.1861345122306,
"y": 14334.848096082915
},
{
"x": 1044.86846138916,
"y": 14007.798157415697
},
{
"x": 1046.109484407434,
"y": 13939.199460368185
},
{
"x": 1041.4020855621407,
"y": 13744.404440084658
},
{
"x": 1049.4868981702027,
"y": 14365.30133992216
},
{
"x": 1049.3933899004292,
"y": 14279.32499798548
},
{
"x": 1048.75178274251,
"y": 14302.08521334565
},
{
"x": 1053.0473716414429,
"y": 14060.65262871494
},
{
"x": 1048.166128132998,
"y": 14198.97251550061
},
{
"x": 1046.84644397306,
"y": 14395.030665623777
},
{
"x": 1047.3320150945005,
"y": 14074.732089982015
},
{
"x": 1050.0475781781179,
"y": 14244.411810134627
},
{
"x": 1044.6605260665622,
"y": 14284.675975978564
},
{
"x": 1051.4817626566312,
"y": 14180.05200328548
}
]
}
],
"drilldown": {},
"tooltip": {
"enabled": true,
"useHTML": false,
"format": null,
"headerFormat": "",
"pointFormat": "<span style=\"color:{series.color}\">Single</span>: <b>{point.x:.0f}</b><br><span style=\"color:{series.color}\">Multi</span>: <b>{point.y:.0f}</b>",
"footerFormat": "",
"shared": false,
"outside": false,
"valueDecimals": null,
"split": false
},
"annotations": null
},
"hc_type": "chart",
"id": "281460631095752017660063905278563236860"
}
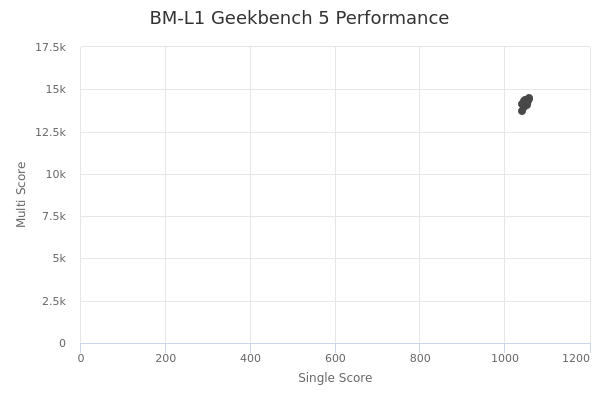
| Single | Multi | |
|---|---|---|
| Max | 1057 | 14513 |
| Average | 1049 | 14209 |
| Deviation | 4.30 | 180.97 |
| Min | 1041 | 13744 |