s3.large.2 by Orange Business
Geekbench is a cross-platform processor benchmark with a scoring system that determines single-core and multi-core performance using loads simulating real-world scenarios. Geekbench 5 score is calculated with a reference score of 2500 representing the performance of the Intel Core i5-2520M @ 2.50 GHz. The software benchmark is available for Mac OS, Windows, Linux, Android and iOS platforms.
Specifications:
CPU
2
RAM
4.0 GB
{
"configuration": {
"chart": {
"type": "scatter",
"polar": false,
"zoomType": "",
"options3d": {},
"height": null,
"width": null,
"margin": null,
"inverted": false,
"zooming": {}
},
"credits": {
"enabled": false
},
"title": {
"text": ""
},
"colorAxis": null,
"subtitle": {
"text": ""
},
"xAxis": {
"title": {
"text": [
"Single Score"
],
"useHTML": false,
"style": {
"color": "#666666"
}
},
"categories": null,
"lineWidth": 1,
"tickInterval": null,
"tickWidth": 1,
"tickLength": 10,
"tickPixelInterval": 100,
"plotLines": null,
"labels": {
"enabled": true,
"format": null,
"formatter": "",
"style": {
"color": "#666666",
"cursor": "default",
"fontSize": "11px"
},
"useHTML": false,
"step": 0
},
"plotBands": null,
"visible": true,
"floor": null,
"ceiling": null,
"type": "linear",
"min": 0,
"gridLineWidth": 1,
"gridLineColor": "#e6e6e6",
"minorTickInterval": null,
"minorTickWidth": 0,
"minTickInterval": null,
"startOnTick": true,
"endOnTick": true,
"tickmarkPlacement": 100,
"units": 100,
"minRange": 100
},
"yAxis": {
"title": {
"text": [
"Multi Score"
],
"useHTML": false,
"style": {
"color": "#666666"
}
},
"categories": null,
"plotLines": null,
"plotBands": null,
"lineWidth": null,
"tickInterval": null,
"tickLength": 10,
"floor": null,
"ceiling": null,
"gridLineInterpolation": null,
"gridLineWidth": 1,
"gridLineColor": "#e6e6e6",
"min": 0,
"max": null,
"minorTickInterval": null,
"minorTickWidth": 0,
"minTickInterval": null,
"startOnTick": true,
"endOnTick": true,
"minRange": null,
"type": "linear",
"tickmarkPlacement": null,
"labels": {
"enabled": true,
"formatter": null,
"style": {
"color": "#666666",
"cursor": "default",
"fontSize": "11px"
},
"useHTML": false
}
},
"zAxis": {
"title": {
"text": "Multi Score"
}
},
"plotOptions": {
"series": {
"dataLabels": {
"enabled": false,
"format": null,
"distance": 30,
"align": "center",
"inside": null,
"allowOverlap": false,
"style": {
"fontSize": "11px"
}
},
"showInLegend": null,
"turboThreshold": 0,
"stacking": "",
"groupPadding": 0.2,
"centerInCategory": false,
"findNearestPointBy": "x"
}
},
"navigator": {
"enabled": false
},
"scrollbar": {
"enabled": false
},
"rangeSelector": {
"enabled": false,
"inputEnabled": false
},
"legend": {
"enabled": null,
"maxHeight": null,
"align": "center",
"verticalAlign": "bottom",
"layout": "horizontal",
"width": null,
"margin": 12,
"reversed": false
},
"series": [
{
"name": "s3.large.2 by Orange Business",
"color": "#fa6600",
"data": [
{
"x": 744.9266174638203,
"y": 1460.1630140002926
},
{
"x": 748.8137693659557,
"y": 1438.6975797323794
},
{
"x": 737.6699698803102,
"y": 1450.6061726183661
},
{
"x": 741.1552574842491,
"y": 1439.6077503849665
},
{
"x": 741.2769007461109,
"y": 1461.0807184040013
},
{
"x": 742.6577706238668,
"y": 1424.0535568403932
},
{
"x": 736.3247120161817,
"y": 1453.558713207831
},
{
"x": 757.6276660466375,
"y": 1442.4338664965833
},
{
"x": 739.0253450639608,
"y": 1471.779549520129
},
{
"x": 744.7269189303496,
"y": 1447.7425122323032
},
{
"x": 751.7538669938561,
"y": 1411.8381788421752
},
{
"x": 738.5136574838929,
"y": 1414.3195257669472
},
{
"x": 746.0449928653197,
"y": 1433.6455649963639
},
{
"x": 735.9935775702879,
"y": 1435.1378301832167
},
{
"x": 751.4091305803195,
"y": 1411.4457844616436
},
{
"x": 735.9596705815628,
"y": 1432.2358365838647
},
{
"x": 747.5925110289236,
"y": 1455.5497159110569
},
{
"x": 740.5958683665998,
"y": 1464.1521428878061
},
{
"x": 753.3172153506366,
"y": 1438.97641905389
},
{
"x": 743.4742408319084,
"y": 1433.8971840664458
},
{
"x": 721.0935730413939,
"y": 1492.1133509774122
},
{
"x": 742.5748091888155,
"y": 1368.989931056219
},
{
"x": 752.1239108321528,
"y": 1481.2331089466993
},
{
"x": 725.6280905606504,
"y": 1362.0175478611718
},
{
"x": 757.4997236605615,
"y": 1473.4134079525284
},
{
"x": 718.7293554637503,
"y": 1369.133250127361
},
{
"x": 753.8718391863682,
"y": 1475.2854040246555
},
{
"x": 713.2681166063367,
"y": 1397.5534215188136
},
{
"x": 742.4202157814758,
"y": 1398.841634135912
},
{
"x": 711.0937093326254,
"y": 1350.9696243840433
},
{
"x": 742.4121878004632,
"y": 1461.8049876888253
},
{
"x": 719.9282333878108,
"y": 1398.7154978322667
},
{
"x": 737.3238824099075,
"y": 1470.7566804920805
},
{
"x": 737.5319647954793,
"y": 1354.602622344359
},
{
"x": 740.6174062801017,
"y": 1489.5677304945893
},
{
"x": 689.0016219215696,
"y": 1330.9490808278142
},
{
"x": 756.338448165921,
"y": 1471.6851316530528
},
{
"x": 708.298430711978,
"y": 1365.044782054253
},
{
"x": 723.4745717774789,
"y": 1474.9660684182213
},
{
"x": 718.6827769230783,
"y": 1332.3003516663355
}
]
}
],
"drilldown": {},
"tooltip": {
"enabled": true,
"useHTML": false,
"format": null,
"headerFormat": "",
"pointFormat": "<span style=\"color:{series.color}\">Single</span>: <b>{point.x:.0f}</b><br><span style=\"color:{series.color}\">Multi</span>: <b>{point.y:.0f}</b>",
"footerFormat": "",
"shared": false,
"outside": false,
"valueDecimals": null,
"split": false
},
"annotations": null
},
"hc_type": "chart",
"id": "222096578862721680788457235539194668470"
}
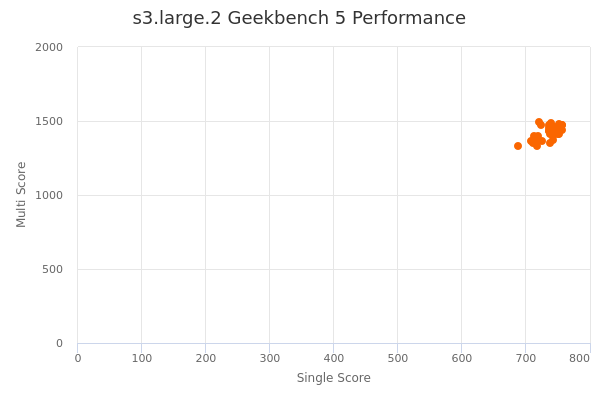
| Single | Multi | |
|---|---|---|
| Max | 758 | 1492 |
| Average | 737 | 1429 |
| Deviation | 15.00 | 44.45 |
| Min | 689 | 1331 |
Sign up as Freemium to get more insight.