s3.2xlarge.4 by Orange Business
Geekbench is a cross-platform processor benchmark with a scoring system that determines single-core and multi-core performance using loads simulating real-world scenarios. Geekbench 5 score is calculated with a reference score of 2500 representing the performance of the Intel Core i5-2520M @ 2.50 GHz. The software benchmark is available for Mac OS, Windows, Linux, Android and iOS platforms.
Specifications:
CPU
8
RAM
32.0 GB
{
"configuration": {
"chart": {
"type": "scatter",
"polar": false,
"zoomType": "",
"options3d": {},
"height": null,
"width": null,
"margin": null,
"inverted": false,
"zooming": {}
},
"credits": {
"enabled": false
},
"title": {
"text": ""
},
"colorAxis": null,
"subtitle": {
"text": ""
},
"xAxis": {
"title": {
"text": [
"Single Score"
],
"useHTML": false,
"style": {
"color": "#666666"
}
},
"categories": null,
"lineWidth": 1,
"tickInterval": null,
"tickWidth": 1,
"tickLength": 10,
"tickPixelInterval": 100,
"plotLines": null,
"labels": {
"enabled": true,
"format": null,
"formatter": "",
"style": {
"color": "#666666",
"cursor": "default",
"fontSize": "11px"
},
"useHTML": false,
"step": 0
},
"plotBands": null,
"visible": true,
"floor": null,
"ceiling": null,
"type": "linear",
"min": 0,
"gridLineWidth": 1,
"gridLineColor": "#e6e6e6",
"minorTickInterval": null,
"minorTickWidth": 0,
"minTickInterval": null,
"startOnTick": true,
"endOnTick": true,
"tickmarkPlacement": 100,
"units": 100,
"minRange": 100
},
"yAxis": {
"title": {
"text": [
"Multi Score"
],
"useHTML": false,
"style": {
"color": "#666666"
}
},
"categories": null,
"plotLines": null,
"plotBands": null,
"lineWidth": null,
"tickInterval": null,
"tickLength": 10,
"floor": null,
"ceiling": null,
"gridLineInterpolation": null,
"gridLineWidth": 1,
"gridLineColor": "#e6e6e6",
"min": 0,
"max": null,
"minorTickInterval": null,
"minorTickWidth": 0,
"minTickInterval": null,
"startOnTick": true,
"endOnTick": true,
"minRange": null,
"type": "linear",
"tickmarkPlacement": null,
"labels": {
"enabled": true,
"formatter": null,
"style": {
"color": "#666666",
"cursor": "default",
"fontSize": "11px"
},
"useHTML": false
}
},
"zAxis": {
"title": {
"text": "Multi Score"
}
},
"plotOptions": {
"series": {
"dataLabels": {
"enabled": false,
"format": null,
"distance": 30,
"align": "center",
"inside": null,
"allowOverlap": false,
"style": {
"fontSize": "11px"
}
},
"showInLegend": null,
"turboThreshold": 0,
"stacking": "",
"groupPadding": 0.2,
"centerInCategory": false,
"findNearestPointBy": "x"
}
},
"navigator": {
"enabled": false
},
"scrollbar": {
"enabled": false
},
"rangeSelector": {
"enabled": false,
"inputEnabled": false
},
"legend": {
"enabled": null,
"maxHeight": null,
"align": "center",
"verticalAlign": "bottom",
"layout": "horizontal",
"width": null,
"margin": 12,
"reversed": false
},
"series": [
{
"name": "s3.2xlarge.4 by Orange Business",
"color": "#fa6600",
"data": [
{
"x": 699.3454414226783,
"y": 4199.316516132514
},
{
"x": 596.6457003782785,
"y": 3612.4385798522208
},
{
"x": 705.3119609190901,
"y": 4001.17273370349
},
{
"x": 612.453167473318,
"y": 3489.9969056944274
},
{
"x": 687.8024970199793,
"y": 4047.1047484504898
},
{
"x": 585.2117954203112,
"y": 3501.584471809687
},
{
"x": 668.818525027342,
"y": 3990.9312813895503
},
{
"x": 578.0289626852378,
"y": 3528.1282800299114
},
{
"x": 691.4250286752278,
"y": 4100.7655689102
},
{
"x": 581.9607418922649,
"y": 3570.3659579191835
},
{
"x": 682.460295369177,
"y": 4079.019008318628
},
{
"x": 590.8200843447261,
"y": 3563.2849171292855
},
{
"x": 690.8105691579239,
"y": 4037.7681188967244
},
{
"x": 579.7077314480755,
"y": 3473.9905110718237
},
{
"x": 677.08785575932,
"y": 3966.1100900049314
},
{
"x": 587.341031346184,
"y": 3612.5290552590345
},
{
"x": 686.9050889028186,
"y": 3929.5527171139775
},
{
"x": 616.8776921015724,
"y": 3532.7971482348776
},
{
"x": 686.3796739040226,
"y": 3999.167564569446
},
{
"x": 602.4297860134386,
"y": 3422.5160070242355
},
{
"x": 779.7934040217674,
"y": 5692.31762933779
},
{
"x": 754.280016184404,
"y": 4870.733451934208
},
{
"x": 766.6027177362056,
"y": 5606.49864851469
},
{
"x": 750.3821127128239,
"y": 4083.081439383309
},
{
"x": 778.5209135576353,
"y": 5685.050255677165
},
{
"x": 741.2939875073222,
"y": 4086.2404775927853
},
{
"x": 774.7567187691849,
"y": 5639.810261458149
},
{
"x": 734.6381126785183,
"y": 4018.0127583599847
},
{
"x": 762.1967466217161,
"y": 5676.4669267008885
},
{
"x": 739.3579821574231,
"y": 4199.671362035011
},
{
"x": 781.1775395010545,
"y": 5783.540508665388
},
{
"x": 739.0919079048459,
"y": 4599.395716737681
},
{
"x": 781.7397289928854,
"y": 5645.242138045956
},
{
"x": 758.8015977134501,
"y": 5238.196302715277
},
{
"x": 775.2831996709276,
"y": 5786.597464482627
},
{
"x": 750.7655498702187,
"y": 5069.50749802608
},
{
"x": 775.4415344254126,
"y": 5758.648603659625
},
{
"x": 737.3359742124667,
"y": 5057.763728104247
},
{
"x": 751.1638019084874,
"y": 5747.554131696983
},
{
"x": 738.657107737692,
"y": 5191.300234216141
}
]
}
],
"drilldown": {},
"tooltip": {
"enabled": true,
"useHTML": false,
"format": null,
"headerFormat": "",
"pointFormat": "<span style=\"color:{series.color}\">Single</span>: <b>{point.x:.0f}</b><br><span style=\"color:{series.color}\">Multi</span>: <b>{point.y:.0f}</b>",
"footerFormat": "",
"shared": false,
"outside": false,
"valueDecimals": null,
"split": false
},
"annotations": null
},
"hc_type": "chart",
"id": "92641039279796653638623494762569970899"
}
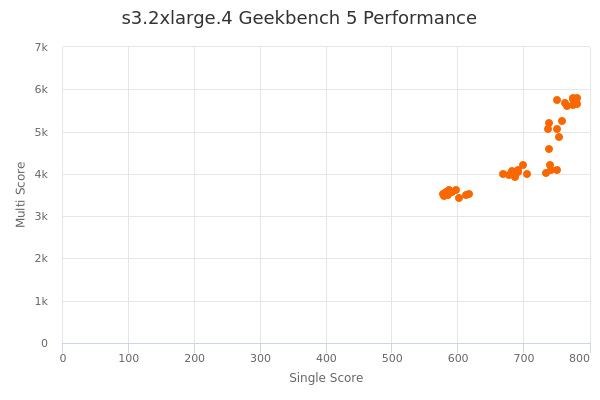
| Single | Multi | |
|---|---|---|
| Max | 782 | 5787 |
| Average | 699 | 4477 |
| Deviation | 69.35 | 845.34 |
| Min | 578 | 3423 |
Sign up as Freemium to get more insight.