c6.4xlarge.2 by Orange Business
Geekbench is a cross-platform processor benchmark with a scoring system that determines single-core and multi-core performance using loads simulating real-world scenarios. Geekbench 5 score is calculated with a reference score of 2500 representing the performance of the Intel Core i5-2520M @ 2.50 GHz. The software benchmark is available for Mac OS, Windows, Linux, Android and iOS platforms.
Specifications:
CPU
16
RAM
32.0 GB
{
"configuration": {
"chart": {
"type": "scatter",
"polar": false,
"zoomType": "",
"options3d": {},
"height": null,
"width": null,
"margin": null,
"inverted": false,
"zooming": {}
},
"credits": {
"enabled": false
},
"title": {
"text": ""
},
"colorAxis": null,
"subtitle": {
"text": ""
},
"xAxis": {
"title": {
"text": [
"Single Score"
],
"useHTML": false,
"style": {
"color": "#666666"
}
},
"categories": null,
"lineWidth": 1,
"tickInterval": null,
"tickWidth": 1,
"tickLength": 10,
"tickPixelInterval": 100,
"plotLines": null,
"labels": {
"enabled": true,
"format": null,
"formatter": "",
"style": {
"color": "#666666",
"cursor": "default",
"fontSize": "11px"
},
"useHTML": false,
"step": 0
},
"plotBands": null,
"visible": true,
"floor": null,
"ceiling": null,
"type": "linear",
"min": 0,
"gridLineWidth": 1,
"gridLineColor": "#e6e6e6",
"minorTickInterval": null,
"minorTickWidth": 0,
"minTickInterval": null,
"startOnTick": true,
"endOnTick": true,
"tickmarkPlacement": 100,
"units": 100,
"minRange": 100
},
"yAxis": {
"title": {
"text": [
"Multi Score"
],
"useHTML": false,
"style": {
"color": "#666666"
}
},
"categories": null,
"plotLines": null,
"plotBands": null,
"lineWidth": null,
"tickInterval": null,
"tickLength": 10,
"floor": null,
"ceiling": null,
"gridLineInterpolation": null,
"gridLineWidth": 1,
"gridLineColor": "#e6e6e6",
"min": 0,
"max": null,
"minorTickInterval": null,
"minorTickWidth": 0,
"minTickInterval": null,
"startOnTick": true,
"endOnTick": true,
"minRange": null,
"type": "linear",
"tickmarkPlacement": null,
"labels": {
"enabled": true,
"formatter": null,
"style": {
"color": "#666666",
"cursor": "default",
"fontSize": "11px"
},
"useHTML": false
}
},
"zAxis": {
"title": {
"text": "Multi Score"
}
},
"plotOptions": {
"series": {
"dataLabels": {
"enabled": false,
"format": null,
"distance": 30,
"align": "center",
"inside": null,
"allowOverlap": false,
"style": {
"fontSize": "11px"
}
},
"showInLegend": null,
"turboThreshold": 0,
"stacking": "",
"groupPadding": 0.2,
"centerInCategory": false,
"findNearestPointBy": "x"
}
},
"navigator": {
"enabled": false
},
"scrollbar": {
"enabled": false
},
"rangeSelector": {
"enabled": false,
"inputEnabled": false
},
"legend": {
"enabled": null,
"maxHeight": null,
"align": "center",
"verticalAlign": "bottom",
"layout": "horizontal",
"width": null,
"margin": 12,
"reversed": false
},
"series": [
{
"name": "c6.4xlarge.2 by Orange Business",
"color": "#fa6600",
"data": [
{
"x": 904.4826434962947,
"y": 12277.781755491975
},
{
"x": 882.4763202068627,
"y": 12325.54603484889
},
{
"x": 900.9335085433484,
"y": 12213.513883151505
},
{
"x": 890.2442533639016,
"y": 12472.327894607111
},
{
"x": 887.0579384949324,
"y": 12387.975360134744
},
{
"x": 859.73131233867,
"y": 11361.867555908611
},
{
"x": 887.4676154857283,
"y": 12396.547394996218
},
{
"x": 905.1329499323896,
"y": 12352.961959827016
},
{
"x": 902.7744296390141,
"y": 12168.249530681987
},
{
"x": 891.0728353175755,
"y": 12393.003919335908
},
{
"x": 900.4276948959023,
"y": 12140.877514774838
},
{
"x": 882.7541246119231,
"y": 12327.726424894941
},
{
"x": 907.5242366654004,
"y": 12141.130831075154
},
{
"x": 889.7475989931401,
"y": 12413.654947201241
},
{
"x": 902.5979662745208,
"y": 12275.042399629438
},
{
"x": 877.9932013209968,
"y": 12383.05159691362
},
{
"x": 898.5988047626352,
"y": 12285.86397573495
},
{
"x": 889.7353003654157,
"y": 12265.478420458381
},
{
"x": 902.0639298843446,
"y": 12142.403432063524
},
{
"x": 886.7059479877748,
"y": 12364.521177831002
},
{
"x": 919.0605990527831,
"y": 12242.720133008319
},
{
"x": 912.3681579095405,
"y": 12241.026931288605
},
{
"x": 913.2631361640481,
"y": 12286.921223385356
},
{
"x": 911.1394916979989,
"y": 12111.876813427514
},
{
"x": 919.140024858837,
"y": 12167.597611018555
},
{
"x": 907.7650406555352,
"y": 12259.252418543925
},
{
"x": 917.5763470493623,
"y": 12347.90688839462
},
{
"x": 909.425450601919,
"y": 12061.717765131812
},
{
"x": 910.6448293106973,
"y": 12036.158712044406
},
{
"x": 911.561139445131,
"y": 12214.131307260275
},
{
"x": 916.4537030112963,
"y": 12273.46494221527
},
{
"x": 909.7828314175833,
"y": 12357.32966743697
},
{
"x": 910.9470732741308,
"y": 12495.07456004614
},
{
"x": 900.9610735659755,
"y": 11984.665280225376
},
{
"x": 905.8918721583995,
"y": 12269.958128294395
},
{
"x": 904.3449072749326,
"y": 12129.070209501015
},
{
"x": 918.0033249534381,
"y": 12216.738783373123
},
{
"x": 906.2350477446898,
"y": 11898.182167417122
},
{
"x": 919.4523366494657,
"y": 11775.90017925981
},
{
"x": 902.5921566706901,
"y": 11564.62374322139
}
]
}
],
"drilldown": {},
"tooltip": {
"enabled": true,
"useHTML": false,
"format": null,
"headerFormat": "",
"pointFormat": "<span style=\"color:{series.color}\">Single</span>: <b>{point.x:.0f}</b><br><span style=\"color:{series.color}\">Multi</span>: <b>{point.y:.0f}</b>",
"footerFormat": "",
"shared": false,
"outside": false,
"valueDecimals": null,
"split": false
},
"annotations": null
},
"hc_type": "chart",
"id": "189748785270172839553345612458068333043"
}
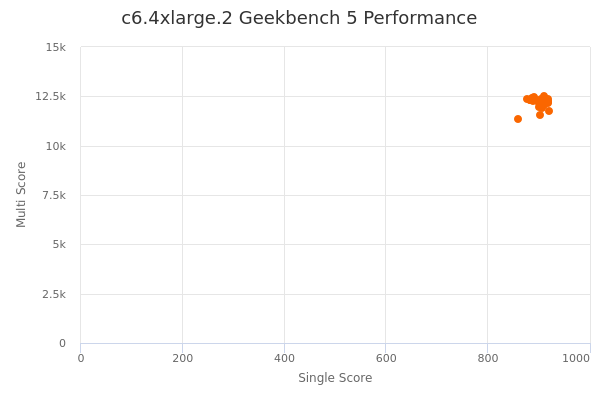
| Single | Multi | |
|---|---|---|
| Max | 919 | 12495 |
| Average | 902 | 12201 |
| Deviation | 12.99 | 224.96 |
| Min | 860 | 11362 |
Sign up as Freemium to get more insight.