c6.3xlarge.4 by Orange Business
Geekbench is a cross-platform processor benchmark with a scoring system that determines single-core and multi-core performance using loads simulating real-world scenarios. Geekbench 5 score is calculated with a reference score of 2500 representing the performance of the Intel Core i5-2520M @ 2.50 GHz. The software benchmark is available for Mac OS, Windows, Linux, Android and iOS platforms.
Specifications:
CPU
12
RAM
48.0 GB
{
"configuration": {
"chart": {
"type": "scatter",
"polar": false,
"zoomType": "",
"options3d": {},
"height": null,
"width": null,
"margin": null,
"inverted": false,
"zooming": {}
},
"credits": {
"enabled": false
},
"title": {
"text": ""
},
"colorAxis": null,
"subtitle": {
"text": ""
},
"xAxis": {
"title": {
"text": [
"Single Score"
],
"useHTML": false,
"style": {
"color": "#666666"
}
},
"categories": null,
"lineWidth": 1,
"tickInterval": null,
"tickWidth": 1,
"tickLength": 10,
"tickPixelInterval": 100,
"plotLines": null,
"labels": {
"enabled": true,
"format": null,
"formatter": "",
"style": {
"color": "#666666",
"cursor": "default",
"fontSize": "11px"
},
"useHTML": false,
"step": 0
},
"plotBands": null,
"visible": true,
"floor": null,
"ceiling": null,
"type": "linear",
"min": 0,
"gridLineWidth": 1,
"gridLineColor": "#e6e6e6",
"minorTickInterval": null,
"minorTickWidth": 0,
"minTickInterval": null,
"startOnTick": true,
"endOnTick": true,
"tickmarkPlacement": 100,
"units": 100,
"minRange": 100
},
"yAxis": {
"title": {
"text": [
"Multi Score"
],
"useHTML": false,
"style": {
"color": "#666666"
}
},
"categories": null,
"plotLines": null,
"plotBands": null,
"lineWidth": null,
"tickInterval": null,
"tickLength": 10,
"floor": null,
"ceiling": null,
"gridLineInterpolation": null,
"gridLineWidth": 1,
"gridLineColor": "#e6e6e6",
"min": 0,
"max": null,
"minorTickInterval": null,
"minorTickWidth": 0,
"minTickInterval": null,
"startOnTick": true,
"endOnTick": true,
"minRange": null,
"type": "linear",
"tickmarkPlacement": null,
"labels": {
"enabled": true,
"formatter": null,
"style": {
"color": "#666666",
"cursor": "default",
"fontSize": "11px"
},
"useHTML": false
}
},
"zAxis": {
"title": {
"text": "Multi Score"
}
},
"plotOptions": {
"series": {
"dataLabels": {
"enabled": false,
"format": null,
"distance": 30,
"align": "center",
"inside": null,
"allowOverlap": false,
"style": {
"fontSize": "11px"
}
},
"showInLegend": null,
"turboThreshold": 0,
"stacking": "",
"groupPadding": 0.2,
"centerInCategory": false,
"findNearestPointBy": "x"
}
},
"navigator": {
"enabled": false
},
"scrollbar": {
"enabled": false
},
"rangeSelector": {
"enabled": false,
"inputEnabled": false
},
"legend": {
"enabled": null,
"maxHeight": null,
"align": "center",
"verticalAlign": "bottom",
"layout": "horizontal",
"width": null,
"margin": 12,
"reversed": false
},
"series": [
{
"name": "c6.3xlarge.4 by Orange Business",
"color": "#fa6600",
"data": [
{
"x": 924.589820224178,
"y": 10063.746525290835
},
{
"x": 919.5057696292469,
"y": 10002.950648532433
},
{
"x": 918.8141130519613,
"y": 10016.350133421402
},
{
"x": 924.9858820862195,
"y": 10069.79166256665
},
{
"x": 922.5871928214353,
"y": 10008.134979972423
},
{
"x": 921.6736355836134,
"y": 10089.352037784072
},
{
"x": 928.4861322319196,
"y": 10069.581821980222
},
{
"x": 920.9759093442951,
"y": 10029.258018000855
},
{
"x": 926.670391397953,
"y": 10074.626707838674
},
{
"x": 918.732016568139,
"y": 10061.574651689632
},
{
"x": 926.3178483136744,
"y": 10099.554663778523
},
{
"x": 921.8022575385073,
"y": 10013.66550509487
},
{
"x": 928.3337989688896,
"y": 9994.856805862853
},
{
"x": 921.1877040706117,
"y": 10082.927340321752
},
{
"x": 925.7025667806914,
"y": 10008.378470305088
},
{
"x": 920.538857917154,
"y": 10048.46982696321
},
{
"x": 926.4115441970928,
"y": 10044.391381816306
},
{
"x": 920.3580837171971,
"y": 10022.30282017357
},
{
"x": 926.1510797163786,
"y": 10008.01720453894
},
{
"x": 917.6047628751628,
"y": 10066.446467943148
}
]
}
],
"drilldown": {},
"tooltip": {
"enabled": true,
"useHTML": false,
"format": null,
"headerFormat": "",
"pointFormat": "<span style=\"color:{series.color}\">Single</span>: <b>{point.x:.0f}</b><br><span style=\"color:{series.color}\">Multi</span>: <b>{point.y:.0f}</b>",
"footerFormat": "",
"shared": false,
"outside": false,
"valueDecimals": null,
"split": false
},
"annotations": null
},
"hc_type": "chart",
"id": "292760957855449385789304296101845513296"
}
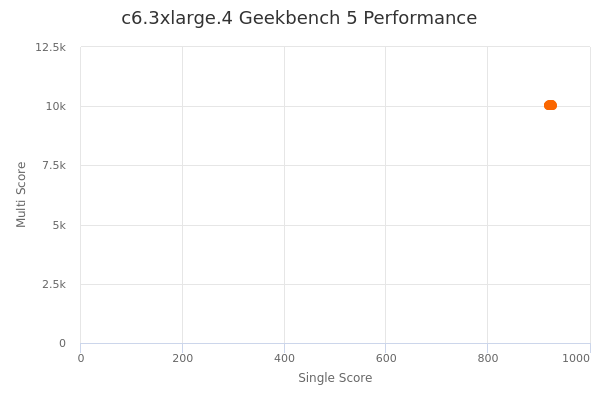
| Single | Multi | |
|---|---|---|
| Max | 928 | 10100 |
| Average | 923 | 10044 |
| Deviation | 3.31 | 31.98 |
| Min | 918 | 9995 |
Sign up as Freemium to get more insight.