VM.Standard1.8 by Oracle Cloud
Geekbench is a cross-platform processor benchmark with a scoring system that determines single-core and multi-core performance using loads simulating real-world scenarios. Geekbench 5 score is calculated with a reference score of 2500 representing the performance of the Intel Core i5-2520M @ 2.50 GHz. The software benchmark is available for Mac OS, Windows, Linux, Android and iOS platforms.
Specifications:
CPU
16
RAM
54.7 GB
Net
2400 Mbps
{
"configuration": {
"chart": {
"type": "scatter",
"polar": false,
"zoomType": "",
"options3d": {},
"height": null,
"width": null,
"margin": null,
"inverted": false,
"zooming": {}
},
"credits": {
"enabled": false
},
"title": {
"text": ""
},
"colorAxis": null,
"subtitle": {
"text": ""
},
"xAxis": {
"title": {
"text": [
"Single Score"
],
"useHTML": false,
"style": {
"color": "#666666"
}
},
"categories": null,
"lineWidth": 1,
"tickInterval": null,
"tickWidth": 1,
"tickLength": 10,
"tickPixelInterval": 100,
"plotLines": null,
"labels": {
"enabled": true,
"format": null,
"formatter": "",
"style": {
"color": "#666666",
"cursor": "default",
"fontSize": "11px"
},
"useHTML": false,
"step": 0
},
"plotBands": null,
"visible": true,
"floor": null,
"ceiling": null,
"type": "linear",
"min": 0,
"gridLineWidth": 1,
"gridLineColor": "#e6e6e6",
"minorTickInterval": null,
"minorTickWidth": 0,
"minTickInterval": null,
"startOnTick": true,
"endOnTick": true,
"tickmarkPlacement": 100,
"units": 100,
"minRange": 100
},
"yAxis": {
"title": {
"text": [
"Multi Score"
],
"useHTML": false,
"style": {
"color": "#666666"
}
},
"categories": null,
"plotLines": null,
"plotBands": null,
"lineWidth": null,
"tickInterval": null,
"tickLength": 10,
"floor": null,
"ceiling": null,
"gridLineInterpolation": null,
"gridLineWidth": 1,
"gridLineColor": "#e6e6e6",
"min": 0,
"max": null,
"minorTickInterval": null,
"minorTickWidth": 0,
"minTickInterval": null,
"startOnTick": true,
"endOnTick": true,
"minRange": null,
"type": "linear",
"tickmarkPlacement": null,
"labels": {
"enabled": true,
"formatter": null,
"style": {
"color": "#666666",
"cursor": "default",
"fontSize": "11px"
},
"useHTML": false
}
},
"zAxis": {
"title": {
"text": "Multi Score"
}
},
"plotOptions": {
"series": {
"dataLabels": {
"enabled": false,
"format": null,
"distance": 30,
"align": "center",
"inside": null,
"allowOverlap": false,
"style": {
"fontSize": "11px"
}
},
"showInLegend": null,
"turboThreshold": 0,
"stacking": "",
"groupPadding": 0.2,
"centerInCategory": false,
"findNearestPointBy": "x"
}
},
"navigator": {
"enabled": false
},
"scrollbar": {
"enabled": false
},
"rangeSelector": {
"enabled": false,
"inputEnabled": false
},
"legend": {
"enabled": null,
"maxHeight": null,
"align": "center",
"verticalAlign": "bottom",
"layout": "horizontal",
"width": null,
"margin": 12,
"reversed": false
},
"series": [
{
"name": "VM.Standard1.8 by Oracle Cloud",
"color": "#FF0000",
"data": [
{
"x": 730.930253765104,
"y": 5868.254780529432
},
{
"x": 717.383385822184,
"y": 5812.149645901854
},
{
"x": 721.2900789765272,
"y": 5885.90989878702
},
{
"x": 723.2051152495277,
"y": 5835.744372983114
},
{
"x": 729.0964043342696,
"y": 5860.971271955938
},
{
"x": 722.0390529565318,
"y": 5777.882911989269
},
{
"x": 718.1718777178756,
"y": 5823.012176609151
},
{
"x": 716.5959308908491,
"y": 5807.433257539953
},
{
"x": 719.6029183843232,
"y": 5858.295757312021
},
{
"x": 719.9307485841298,
"y": 5845.051622333699
},
{
"x": 714.543568751785,
"y": 5836.893967787129
},
{
"x": 715.4694014302562,
"y": 5814.444220870293
},
{
"x": 723.4450317550535,
"y": 5881.887033130702
},
{
"x": 715.0988416597089,
"y": 5858.224281419962
},
{
"x": 726.6718248585091,
"y": 5816.764867117848
},
{
"x": 721.8933055792455,
"y": 5798.09485956602
},
{
"x": 721.4195167450167,
"y": 5782.4467935330495
},
{
"x": 712.9721723626667,
"y": 5776.792484174335
},
{
"x": 720.7689713865194,
"y": 5862.02020149949
},
{
"x": 723.4210282725045,
"y": 5846.636895503041
}
]
}
],
"drilldown": {},
"tooltip": {
"enabled": true,
"useHTML": false,
"format": null,
"headerFormat": "",
"pointFormat": "<span style=\"color:{series.color}\">Single</span>: <b>{point.x:.0f}</b><br><span style=\"color:{series.color}\">Multi</span>: <b>{point.y:.0f}</b>",
"footerFormat": "",
"shared": false,
"outside": false,
"valueDecimals": null,
"split": false
},
"annotations": null
},
"hc_type": "chart",
"id": "153318210095415636938249580819774619883"
}
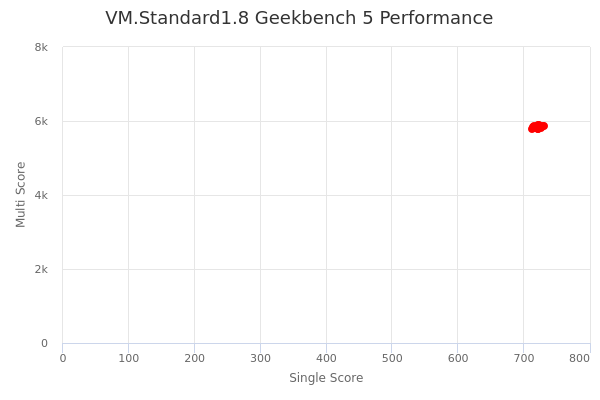
| Single | Multi | |
|---|---|---|
| Max | 731 | 5886 |
| Average | 721 | 5832 |
| Deviation | 4.63 | 32.75 |
| Min | 713 | 5777 |
Sign up as Freemium to get more insight.
- In same series
- VM.Standard1.1
- VM.Standard1.2
- VM.Standard1.4
- VM.Standard1.8
- VM.Standard1.16