VM.Standard1.1 by Oracle Cloud
Geekbench is a cross-platform processor benchmark with a scoring system that determines single-core and multi-core performance using loads simulating real-world scenarios. Geekbench 5 score is calculated with a reference score of 2500 representing the performance of the Intel Core i5-2520M @ 2.50 GHz. The software benchmark is available for Mac OS, Windows, Linux, Android and iOS platforms.
Specifications:
CPU
2
RAM
6.8 GB
Net
600 Mbps
{
"configuration": {
"chart": {
"type": "scatter",
"polar": false,
"zoomType": "",
"options3d": {},
"height": null,
"width": null,
"margin": null,
"inverted": false,
"zooming": {}
},
"credits": {
"enabled": false
},
"title": {
"text": ""
},
"colorAxis": null,
"subtitle": {
"text": ""
},
"xAxis": {
"title": {
"text": [
"Single Score"
],
"useHTML": false,
"style": {
"color": "#666666"
}
},
"categories": null,
"lineWidth": 1,
"tickInterval": null,
"tickWidth": 1,
"tickLength": 10,
"tickPixelInterval": 100,
"plotLines": null,
"labels": {
"enabled": true,
"format": null,
"formatter": "",
"style": {
"color": "#666666",
"cursor": "default",
"fontSize": "11px"
},
"useHTML": false,
"step": 0
},
"plotBands": null,
"visible": true,
"floor": null,
"ceiling": null,
"type": "linear",
"min": 0,
"gridLineWidth": 1,
"gridLineColor": "#e6e6e6",
"minorTickInterval": null,
"minorTickWidth": 0,
"minTickInterval": null,
"startOnTick": true,
"endOnTick": true,
"tickmarkPlacement": 100,
"units": 100,
"minRange": 100
},
"yAxis": {
"title": {
"text": [
"Multi Score"
],
"useHTML": false,
"style": {
"color": "#666666"
}
},
"categories": null,
"plotLines": null,
"plotBands": null,
"lineWidth": null,
"tickInterval": null,
"tickLength": 10,
"floor": null,
"ceiling": null,
"gridLineInterpolation": null,
"gridLineWidth": 1,
"gridLineColor": "#e6e6e6",
"min": 0,
"max": null,
"minorTickInterval": null,
"minorTickWidth": 0,
"minTickInterval": null,
"startOnTick": true,
"endOnTick": true,
"minRange": null,
"type": "linear",
"tickmarkPlacement": null,
"labels": {
"enabled": true,
"formatter": null,
"style": {
"color": "#666666",
"cursor": "default",
"fontSize": "11px"
},
"useHTML": false
}
},
"zAxis": {
"title": {
"text": "Multi Score"
}
},
"plotOptions": {
"series": {
"dataLabels": {
"enabled": false,
"format": null,
"distance": 30,
"align": "center",
"inside": null,
"allowOverlap": false,
"style": {
"fontSize": "11px"
}
},
"showInLegend": null,
"turboThreshold": 0,
"stacking": "",
"groupPadding": 0.2,
"centerInCategory": false,
"findNearestPointBy": "x"
}
},
"navigator": {
"enabled": false
},
"scrollbar": {
"enabled": false
},
"rangeSelector": {
"enabled": false,
"inputEnabled": false
},
"legend": {
"enabled": null,
"maxHeight": null,
"align": "center",
"verticalAlign": "bottom",
"layout": "horizontal",
"width": null,
"margin": 12,
"reversed": false
},
"series": [
{
"name": "VM.Standard1.1 by Oracle Cloud",
"color": "#FF0000",
"data": [
{
"x": 681.1527640880638,
"y": 794.5963036604043
},
{
"x": 683.2382512884097,
"y": 794.7568507947634
},
{
"x": 683.7564774368204,
"y": 790.841989592697
},
{
"x": 685.3550764228978,
"y": 799.3359438704366
},
{
"x": 681.0130407885309,
"y": 793.9162268165289
},
{
"x": 685.9500942249176,
"y": 792.5596367483156
},
{
"x": 681.3615468421041,
"y": 793.0845421137235
},
{
"x": 684.8715122480146,
"y": 797.8909814426452
},
{
"x": 685.3448992106548,
"y": 791.7151833420362
},
{
"x": 678.9950120178039,
"y": 796.2400476027871
},
{
"x": 714.3012228372772,
"y": 820.0490056475678
},
{
"x": 702.9275937548773,
"y": 806.4280002496353
},
{
"x": 714.2243864701184,
"y": 809.8201349509864
},
{
"x": 697.0073777526983,
"y": 795.3543882239728
},
{
"x": 702.1234359491012,
"y": 810.1554789514784
},
{
"x": 704.201161586417,
"y": 802.092193736436
},
{
"x": 704.4004444379611,
"y": 795.1749280319191
},
{
"x": 701.5428702645278,
"y": 803.4538515225274
},
{
"x": 700.0119471355213,
"y": 811.356122065459
},
{
"x": 703.2109490207378,
"y": 801.1154177725165
}
]
}
],
"drilldown": {},
"tooltip": {
"enabled": true,
"useHTML": false,
"format": null,
"headerFormat": "",
"pointFormat": "<span style=\"color:{series.color}\">Single</span>: <b>{point.x:.0f}</b><br><span style=\"color:{series.color}\">Multi</span>: <b>{point.y:.0f}</b>",
"footerFormat": "",
"shared": false,
"outside": false,
"valueDecimals": null,
"split": false
},
"annotations": null
},
"hc_type": "chart",
"id": "240172689715583262524719081786084952207"
}
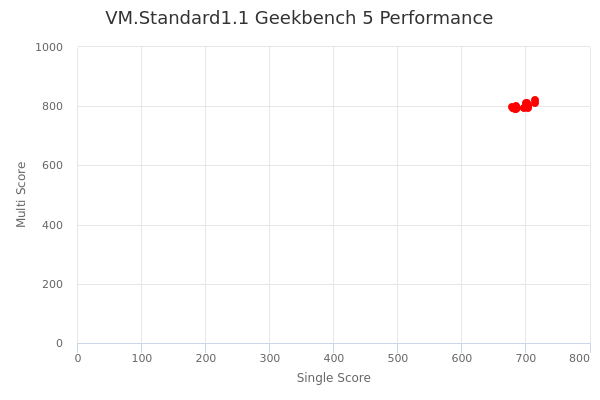
| Single | Multi | |
|---|---|---|
| Max | 714 | 820 |
| Average | 694 | 800 |
| Deviation | 11.41 | 7.75 |
| Min | 679 | 791 |
Sign up as Freemium to get more insight.
- In same series
- VM.Standard1.1
- VM.Standard1.2
- VM.Standard1.4
- VM.Standard1.8
- VM.Standard1.16