Dedicated 4GB by Linode
Geekbench is a cross-platform processor benchmark with a scoring system that determines single-core and multi-core performance using loads simulating real-world scenarios. Geekbench 5 score is calculated with a reference score of 2500 representing the performance of the Intel Core i5-2520M @ 2.50 GHz. The software benchmark is available for Mac OS, Windows, Linux, Android and iOS platforms.
Specifications:
CPU
2
RAM
4.0 GB
Root
80 GB
g6-dedicated-2 root
Net
40000 Mbps
{
"configuration": {
"chart": {
"type": "scatter",
"polar": false,
"zoomType": "",
"options3d": {},
"height": null,
"width": null,
"margin": null,
"inverted": false,
"zooming": {}
},
"credits": {
"enabled": false
},
"title": {
"text": ""
},
"colorAxis": null,
"subtitle": {
"text": ""
},
"xAxis": {
"title": {
"text": [
"Single Score"
],
"useHTML": false,
"style": {
"color": "#666666"
}
},
"categories": null,
"lineWidth": 1,
"tickInterval": null,
"tickWidth": 1,
"tickLength": 10,
"tickPixelInterval": 100,
"plotLines": null,
"labels": {
"enabled": true,
"format": null,
"formatter": "",
"style": {
"color": "#666666",
"cursor": "default",
"fontSize": "11px"
},
"useHTML": false,
"step": 0
},
"plotBands": null,
"visible": true,
"floor": null,
"ceiling": null,
"type": "linear",
"min": 0,
"gridLineWidth": 1,
"gridLineColor": "#e6e6e6",
"minorTickInterval": null,
"minorTickWidth": 0,
"minTickInterval": null,
"startOnTick": true,
"endOnTick": true,
"tickmarkPlacement": 100,
"units": 100,
"minRange": 100
},
"yAxis": {
"title": {
"text": [
"Multi Score"
],
"useHTML": false,
"style": {
"color": "#666666"
}
},
"categories": null,
"plotLines": null,
"plotBands": null,
"lineWidth": null,
"tickInterval": null,
"tickLength": 10,
"floor": null,
"ceiling": null,
"gridLineInterpolation": null,
"gridLineWidth": 1,
"gridLineColor": "#e6e6e6",
"min": 0,
"max": null,
"minorTickInterval": null,
"minorTickWidth": 0,
"minTickInterval": null,
"startOnTick": true,
"endOnTick": true,
"minRange": null,
"type": "linear",
"tickmarkPlacement": null,
"labels": {
"enabled": true,
"formatter": null,
"style": {
"color": "#666666",
"cursor": "default",
"fontSize": "11px"
},
"useHTML": false
}
},
"zAxis": {
"title": {
"text": "Multi Score"
}
},
"plotOptions": {
"series": {
"dataLabels": {
"enabled": false,
"format": null,
"distance": 30,
"align": "center",
"inside": null,
"allowOverlap": false,
"style": {
"fontSize": "11px"
}
},
"showInLegend": null,
"turboThreshold": 0,
"stacking": "",
"groupPadding": 0.2,
"centerInCategory": false,
"findNearestPointBy": "x"
}
},
"navigator": {
"enabled": false
},
"scrollbar": {
"enabled": false
},
"rangeSelector": {
"enabled": false,
"inputEnabled": false
},
"legend": {
"enabled": null,
"maxHeight": null,
"align": "center",
"verticalAlign": "bottom",
"layout": "horizontal",
"width": null,
"margin": 12,
"reversed": false
},
"series": [
{
"name": "Dedicated 4GB by Linode",
"color": "#00b64c",
"data": [
{
"x": 660.0366810068892,
"y": 872.2935146721104
},
{
"x": 622.7464020941854,
"y": 840.1917947357884
},
{
"x": 607.1701379935184,
"y": 839.8985864929762
},
{
"x": 603.7511149536704,
"y": 815.2057799369837
},
{
"x": 589.2410059250259,
"y": 814.1690167593515
},
{
"x": 596.8499128724712,
"y": 878.8659762580403
},
{
"x": 569.7905503354403,
"y": 843.1430723544277
},
{
"x": 594.5093366088514,
"y": 875.556724291256
},
{
"x": 572.5424314679218,
"y": 844.6617785479655
},
{
"x": 594.3795667399843,
"y": 877.8410555732892
},
{
"x": 570.8086612027337,
"y": 831.9744464424343
},
{
"x": 596.387014902053,
"y": 875.1712316855715
},
{
"x": 569.6450939812856,
"y": 842.0901358900112
},
{
"x": 592.5569639830599,
"y": 871.9054205540976
},
{
"x": 568.6417077957519,
"y": 841.7202936090463
},
{
"x": 596.5201074446763,
"y": 856.0757889855987
},
{
"x": 572.6108138353572,
"y": 837.6339684091288
},
{
"x": 591.067024639142,
"y": 872.7962796623415
},
{
"x": 574.7577465690302,
"y": 831.2236482441051
},
{
"x": 587.9426020273163,
"y": 870.9268122276924
},
{
"x": 571.4580919568582,
"y": 835.0121172062545
},
{
"x": 588.527109223833,
"y": 866.4457647409373
},
{
"x": 570.4147673019264,
"y": 835.3176792561027
},
{
"x": 592.2936882920801,
"y": 882.3605963773718
},
{
"x": 572.9858042894525,
"y": 837.7305227409765
},
{
"x": 914.6183846948597,
"y": 1239.2419312332715
},
{
"x": 775.5181524486056,
"y": 983.7682681865758
},
{
"x": 911.1134317009862,
"y": 1253.9661925563955
},
{
"x": 772.4776739620797,
"y": 988.2913343520322
},
{
"x": 941.9532222384237,
"y": 1250.3055149104782
},
{
"x": 779.8723423111259,
"y": 1039.6914843730685
}
]
}
],
"drilldown": {},
"tooltip": {
"enabled": true,
"useHTML": false,
"format": null,
"headerFormat": "",
"pointFormat": "<span style=\"color:{series.color}\">Single</span>: <b>{point.x:.0f}</b><br><span style=\"color:{series.color}\">Multi</span>: <b>{point.y:.0f}</b>",
"footerFormat": "",
"shared": false,
"outside": false,
"valueDecimals": null,
"split": false
},
"annotations": null
},
"hc_type": "chart",
"id": "227070248007594364447238288184604987835"
}
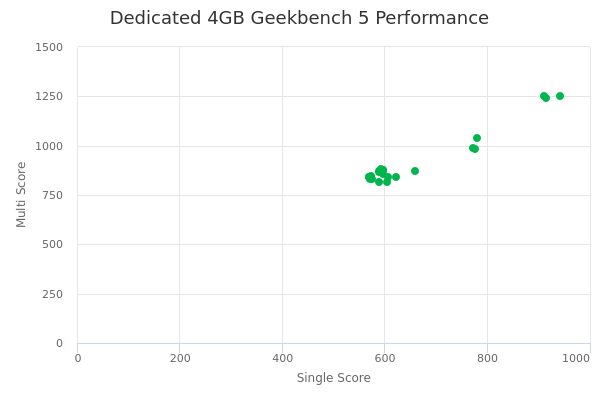
| Single | Multi | |
|---|---|---|
| Max | 942 | 1254 |
| Average | 639 | 905 |
| Deviation | 109.32 | 122.57 |
| Min | 569 | 814 |
Sign up as Freemium to get more insight.