Dedicated 32GB by Linode
Geekbench is a cross-platform processor benchmark with a scoring system that determines single-core and multi-core performance using loads simulating real-world scenarios. Geekbench 5 score is calculated with a reference score of 2500 representing the performance of the Intel Core i5-2520M @ 2.50 GHz. The software benchmark is available for Mac OS, Windows, Linux, Android and iOS platforms.
Specifications:
CPU
16
RAM
32.0 GB
Root
640 GB
g6-dedicated-16 root
Net
40000 Mbps
{
"configuration": {
"chart": {
"type": "scatter",
"polar": false,
"zoomType": "",
"options3d": {},
"height": null,
"width": null,
"margin": null,
"inverted": false,
"zooming": {}
},
"credits": {
"enabled": false
},
"title": {
"text": ""
},
"colorAxis": null,
"subtitle": {
"text": ""
},
"xAxis": {
"title": {
"text": [
"Single Score"
],
"useHTML": false,
"style": {
"color": "#666666"
}
},
"categories": null,
"lineWidth": 1,
"tickInterval": null,
"tickWidth": 1,
"tickLength": 10,
"tickPixelInterval": 100,
"plotLines": null,
"labels": {
"enabled": true,
"format": null,
"formatter": "",
"style": {
"color": "#666666",
"cursor": "default",
"fontSize": "11px"
},
"useHTML": false,
"step": 0
},
"plotBands": null,
"visible": true,
"floor": null,
"ceiling": null,
"type": "linear",
"min": 0,
"gridLineWidth": 1,
"gridLineColor": "#e6e6e6",
"minorTickInterval": null,
"minorTickWidth": 0,
"minTickInterval": null,
"startOnTick": true,
"endOnTick": true,
"tickmarkPlacement": 100,
"units": 100,
"minRange": 100
},
"yAxis": {
"title": {
"text": [
"Multi Score"
],
"useHTML": false,
"style": {
"color": "#666666"
}
},
"categories": null,
"plotLines": null,
"plotBands": null,
"lineWidth": null,
"tickInterval": null,
"tickLength": 10,
"floor": null,
"ceiling": null,
"gridLineInterpolation": null,
"gridLineWidth": 1,
"gridLineColor": "#e6e6e6",
"min": 0,
"max": null,
"minorTickInterval": null,
"minorTickWidth": 0,
"minTickInterval": null,
"startOnTick": true,
"endOnTick": true,
"minRange": null,
"type": "linear",
"tickmarkPlacement": null,
"labels": {
"enabled": true,
"formatter": null,
"style": {
"color": "#666666",
"cursor": "default",
"fontSize": "11px"
},
"useHTML": false
}
},
"zAxis": {
"title": {
"text": "Multi Score"
}
},
"plotOptions": {
"series": {
"dataLabels": {
"enabled": false,
"format": null,
"distance": 30,
"align": "center",
"inside": null,
"allowOverlap": false,
"style": {
"fontSize": "11px"
}
},
"showInLegend": null,
"turboThreshold": 0,
"stacking": "",
"groupPadding": 0.2,
"centerInCategory": false,
"findNearestPointBy": "x"
}
},
"navigator": {
"enabled": false
},
"scrollbar": {
"enabled": false
},
"rangeSelector": {
"enabled": false,
"inputEnabled": false
},
"legend": {
"enabled": null,
"maxHeight": null,
"align": "center",
"verticalAlign": "bottom",
"layout": "horizontal",
"width": null,
"margin": 12,
"reversed": false
},
"series": [
{
"name": "Dedicated 32GB by Linode",
"color": "#00b64c",
"data": [
{
"x": 970.439931443115,
"y": 7841.360753100189
},
{
"x": 970.7559171076095,
"y": 7584.573280475787
},
{
"x": 969.6262141847371,
"y": 7895.110033514356
},
{
"x": 941.4108178162514,
"y": 7736.639071216201
},
{
"x": 969.3458567561803,
"y": 7663.135728224797
},
{
"x": 945.4816433233373,
"y": 7726.161053785945
},
{
"x": 955.0476479446547,
"y": 7862.796918320933
},
{
"x": 953.6335101701995,
"y": 7956.0906544145955
},
{
"x": 966.0527048644594,
"y": 7861.8367563533375
},
{
"x": 958.0018935520858,
"y": 7815.490452870845
},
{
"x": 967.25752641336,
"y": 7815.763375178403
},
{
"x": 956.0514885490586,
"y": 7984.432419465009
},
{
"x": 974.0214041233689,
"y": 7885.207800748807
},
{
"x": 931.7313136133537,
"y": 8161.111223618271
},
{
"x": 973.9570623137581,
"y": 7822.333548909113
},
{
"x": 926.6658194643851,
"y": 7903.936875919382
},
{
"x": 976.1384319632828,
"y": 7817.737591339843
},
{
"x": 932.0362403529462,
"y": 7835.000397408229
},
{
"x": 976.0136650460943,
"y": 7808.2981884132105
},
{
"x": 954.9683967595167,
"y": 7849.609299390914
},
{
"x": 957.2245981099247,
"y": 7394.298485430249
},
{
"x": 960.318894160208,
"y": 7034.051862410227
},
{
"x": 956.9281664795033,
"y": 7302.130380228524
},
{
"x": 942.9198922521107,
"y": 7132.387137044701
},
{
"x": 955.6926228615972,
"y": 7364.383111865478
},
{
"x": 936.2457278938152,
"y": 7165.049877775728
}
]
}
],
"drilldown": {},
"tooltip": {
"enabled": true,
"useHTML": false,
"format": null,
"headerFormat": "",
"pointFormat": "<span style=\"color:{series.color}\">Single</span>: <b>{point.x:.0f}</b><br><span style=\"color:{series.color}\">Multi</span>: <b>{point.y:.0f}</b>",
"footerFormat": "",
"shared": false,
"outside": false,
"valueDecimals": null,
"split": false
},
"annotations": null
},
"hc_type": "chart",
"id": "335744783238609659752339242354503430709"
}
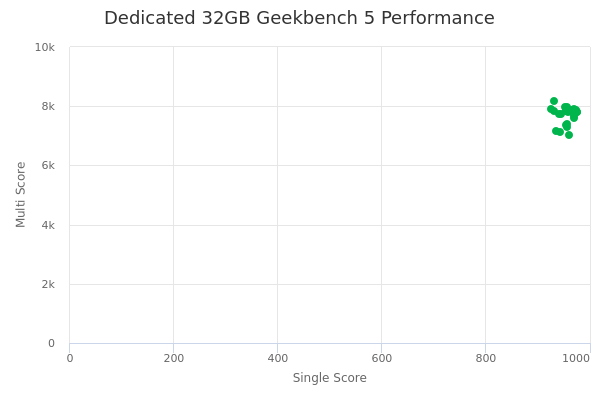
| Single | Multi | |
|---|---|---|
| Max | 976 | 8161 |
| Average | 957 | 7701 |
| Deviation | 14.40 | 283.29 |
| Min | 927 | 7034 |
Sign up as Freemium to get more insight.