cc1.small by leafcloud
Geekbench is a cross-platform processor benchmark with a scoring system that determines single-core and multi-core performance using loads simulating real-world scenarios. Geekbench 5 score is calculated with a reference score of 2500 representing the performance of the Intel Core i5-2520M @ 2.50 GHz. The software benchmark is available for Mac OS, Windows, Linux, Android and iOS platforms.
Specifications:
CPU
1
RAM
2.0 GB
Root
20 GB
cc1.small Root SSD
{
"configuration": {
"chart": {
"type": "scatter",
"polar": false,
"zoomType": "",
"options3d": {},
"height": null,
"width": null,
"margin": null,
"inverted": false,
"zooming": {}
},
"credits": {
"enabled": false
},
"title": {
"text": ""
},
"colorAxis": null,
"subtitle": {
"text": ""
},
"xAxis": {
"title": {
"text": [
"Single Score"
],
"useHTML": false,
"style": {
"color": "#666666"
}
},
"categories": null,
"lineWidth": 1,
"tickInterval": null,
"tickWidth": 1,
"tickLength": 10,
"tickPixelInterval": 100,
"plotLines": null,
"labels": {
"enabled": true,
"format": null,
"formatter": "",
"style": {
"color": "#666666",
"cursor": "default",
"fontSize": "11px"
},
"useHTML": false,
"step": 0
},
"plotBands": null,
"visible": true,
"floor": null,
"ceiling": null,
"type": "linear",
"min": 0,
"gridLineWidth": 1,
"gridLineColor": "#e6e6e6",
"minorTickInterval": null,
"minorTickWidth": 0,
"minTickInterval": null,
"startOnTick": true,
"endOnTick": true,
"tickmarkPlacement": 100,
"units": 100,
"minRange": 100
},
"yAxis": {
"title": {
"text": [
"Multi Score"
],
"useHTML": false,
"style": {
"color": "#666666"
}
},
"categories": null,
"plotLines": null,
"plotBands": null,
"lineWidth": null,
"tickInterval": null,
"tickLength": 10,
"floor": null,
"ceiling": null,
"gridLineInterpolation": null,
"gridLineWidth": 1,
"gridLineColor": "#e6e6e6",
"min": 0,
"max": null,
"minorTickInterval": null,
"minorTickWidth": 0,
"minTickInterval": null,
"startOnTick": true,
"endOnTick": true,
"minRange": null,
"type": "linear",
"tickmarkPlacement": null,
"labels": {
"enabled": true,
"formatter": null,
"style": {
"color": "#666666",
"cursor": "default",
"fontSize": "11px"
},
"useHTML": false
}
},
"zAxis": {
"title": {
"text": "Multi Score"
}
},
"plotOptions": {
"series": {
"dataLabels": {
"enabled": false,
"format": null,
"distance": 30,
"align": "center",
"inside": null,
"allowOverlap": false,
"style": {
"fontSize": "11px"
}
},
"showInLegend": null,
"turboThreshold": 0,
"stacking": "",
"groupPadding": 0.2,
"centerInCategory": false,
"findNearestPointBy": "x"
}
},
"navigator": {
"enabled": false
},
"scrollbar": {
"enabled": false
},
"rangeSelector": {
"enabled": false,
"inputEnabled": false
},
"legend": {
"enabled": null,
"maxHeight": null,
"align": "center",
"verticalAlign": "bottom",
"layout": "horizontal",
"width": null,
"margin": 12,
"reversed": false
},
"series": [
{
"name": "cc1.small by leafcloud",
"color": "#32f295",
"data": [
{
"x": 666.579460090693,
"y": 682.7726195270395
},
{
"x": 669.5377997149603,
"y": 662.6073227654009
},
{
"x": 687.7702865475603,
"y": 683.1229618396726
},
{
"x": 674.062649224512,
"y": 692.0544162498029
},
{
"x": 679.9861049818555,
"y": 671.2308635526567
},
{
"x": 683.1765080938421,
"y": 686.5773501047339
},
{
"x": 691.7218361240716,
"y": 680.2887458951473
},
{
"x": 659.5098257270972,
"y": 674.3575561676975
},
{
"x": 691.9022412668935,
"y": 695.206282828476
},
{
"x": 684.1391080675053,
"y": 695.2291305099079
},
{
"x": 681.5825171040253,
"y": 687.8214554661934
},
{
"x": 686.1808313961504,
"y": 688.4808792163353
},
{
"x": 690.0246910433616,
"y": 700.5042535480694
},
{
"x": 690.2642700844323,
"y": 692.2014941999064
},
{
"x": 689.2107411617089,
"y": 680.0644907941232
},
{
"x": 682.1648429344249,
"y": 687.6739581880456
},
{
"x": 686.7449782368583,
"y": 696.4628789461369
},
{
"x": 690.5365985656744,
"y": 691.1553515828182
},
{
"x": 688.7376782358068,
"y": 682.6829441512783
},
{
"x": 689.5295776795544,
"y": 686.3364073291624
}
]
}
],
"drilldown": {},
"tooltip": {
"enabled": true,
"useHTML": false,
"format": null,
"headerFormat": "",
"pointFormat": "<span style=\"color:{series.color}\">Single</span>: <b>{point.x:.0f}</b><br><span style=\"color:{series.color}\">Multi</span>: <b>{point.y:.0f}</b>",
"footerFormat": "",
"shared": false,
"outside": false,
"valueDecimals": null,
"split": false
},
"annotations": null
},
"hc_type": "chart",
"id": "132985339400380183318530579170541159107"
}
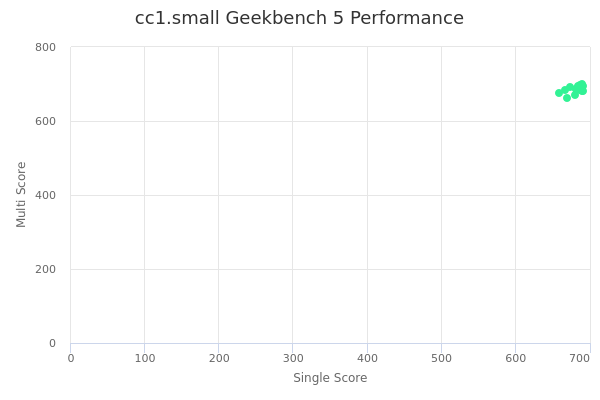
| Single | Multi | |
|---|---|---|
| Max | 692 | 701 |
| Average | 683 | 686 |
| Deviation | 8.86 | 8.95 |
| Min | 660 | 663 |
Sign up as Freemium to get more insight.
- In same series
- cc1.xsmall
- cc1.small
- cc1.medium
- cc1.large
- cc1.xlarge
- cc1.2xlarge
- cc1.3xlarge
- cc1.4xlarge
- cc1.8xlarge