cc1.large by leafcloud
Geekbench is a cross-platform processor benchmark with a scoring system that determines single-core and multi-core performance using loads simulating real-world scenarios. Geekbench 5 score is calculated with a reference score of 2500 representing the performance of the Intel Core i5-2520M @ 2.50 GHz. The software benchmark is available for Mac OS, Windows, Linux, Android and iOS platforms.
Specifications:
CPU
4
RAM
8.0 GB
Root
20 GB
cc1.large Root SSD
{
"configuration": {
"chart": {
"type": "scatter",
"polar": false,
"zoomType": "",
"options3d": {},
"height": null,
"width": null,
"margin": null,
"inverted": false,
"zooming": {}
},
"credits": {
"enabled": false
},
"title": {
"text": ""
},
"colorAxis": null,
"subtitle": {
"text": ""
},
"xAxis": {
"title": {
"text": [
"Single Score"
],
"useHTML": false,
"style": {
"color": "#666666"
}
},
"categories": null,
"lineWidth": 1,
"tickInterval": null,
"tickWidth": 1,
"tickLength": 10,
"tickPixelInterval": 100,
"plotLines": null,
"labels": {
"enabled": true,
"format": null,
"formatter": "",
"style": {
"color": "#666666",
"cursor": "default",
"fontSize": "11px"
},
"useHTML": false,
"step": 0
},
"plotBands": null,
"visible": true,
"floor": null,
"ceiling": null,
"type": "linear",
"min": 0,
"gridLineWidth": 1,
"gridLineColor": "#e6e6e6",
"minorTickInterval": null,
"minorTickWidth": 0,
"minTickInterval": null,
"startOnTick": true,
"endOnTick": true,
"tickmarkPlacement": 100,
"units": 100,
"minRange": 100
},
"yAxis": {
"title": {
"text": [
"Multi Score"
],
"useHTML": false,
"style": {
"color": "#666666"
}
},
"categories": null,
"plotLines": null,
"plotBands": null,
"lineWidth": null,
"tickInterval": null,
"tickLength": 10,
"floor": null,
"ceiling": null,
"gridLineInterpolation": null,
"gridLineWidth": 1,
"gridLineColor": "#e6e6e6",
"min": 0,
"max": null,
"minorTickInterval": null,
"minorTickWidth": 0,
"minTickInterval": null,
"startOnTick": true,
"endOnTick": true,
"minRange": null,
"type": "linear",
"tickmarkPlacement": null,
"labels": {
"enabled": true,
"formatter": null,
"style": {
"color": "#666666",
"cursor": "default",
"fontSize": "11px"
},
"useHTML": false
}
},
"zAxis": {
"title": {
"text": "Multi Score"
}
},
"plotOptions": {
"series": {
"dataLabels": {
"enabled": false,
"format": null,
"distance": 30,
"align": "center",
"inside": null,
"allowOverlap": false,
"style": {
"fontSize": "11px"
}
},
"showInLegend": null,
"turboThreshold": 0,
"stacking": "",
"groupPadding": 0.2,
"centerInCategory": false,
"findNearestPointBy": "x"
}
},
"navigator": {
"enabled": false
},
"scrollbar": {
"enabled": false
},
"rangeSelector": {
"enabled": false,
"inputEnabled": false
},
"legend": {
"enabled": null,
"maxHeight": null,
"align": "center",
"verticalAlign": "bottom",
"layout": "horizontal",
"width": null,
"margin": 12,
"reversed": false
},
"series": [
{
"name": "cc1.large by leafcloud",
"color": "#32f295",
"data": [
{
"x": 682.6410791350852,
"y": 2574.987918836204
},
{
"x": 663.8914388471828,
"y": 2484.321732504777
},
{
"x": 666.8182244774193,
"y": 2596.882812492405
},
{
"x": 665.5790233998789,
"y": 2488.7675498779463
},
{
"x": 667.630451094296,
"y": 2601.076811441897
},
{
"x": 665.4045836960067,
"y": 2558.301165238742
},
{
"x": 664.8364792234919,
"y": 2589.52561690686
},
{
"x": 654.1635399139984,
"y": 2521.26686113927
},
{
"x": 673.1316146157019,
"y": 2638.414270035942
},
{
"x": 663.110322970668,
"y": 2514.7393859796935
},
{
"x": 671.9940010106297,
"y": 2614.876440049533
},
{
"x": 663.291846724817,
"y": 2504.2387266649234
},
{
"x": 676.0306878364207,
"y": 2622.1124634814746
},
{
"x": 658.2518956144683,
"y": 2500.678817225052
},
{
"x": 666.1461268668079,
"y": 2644.9842420858095
},
{
"x": 667.4498432734664,
"y": 2536.70352146465
},
{
"x": 673.0352790622555,
"y": 2601.6049249040975
},
{
"x": 665.3998356040651,
"y": 2531.7180104907975
},
{
"x": 674.6654874393566,
"y": 2646.2858551761237
},
{
"x": 668.807190781084,
"y": 2462.332497310238
}
]
}
],
"drilldown": {},
"tooltip": {
"enabled": true,
"useHTML": false,
"format": null,
"headerFormat": "",
"pointFormat": "<span style=\"color:{series.color}\">Single</span>: <b>{point.x:.0f}</b><br><span style=\"color:{series.color}\">Multi</span>: <b>{point.y:.0f}</b>",
"footerFormat": "",
"shared": false,
"outside": false,
"valueDecimals": null,
"split": false
},
"annotations": null
},
"hc_type": "chart",
"id": "108700655360705312341356164155671689526"
}
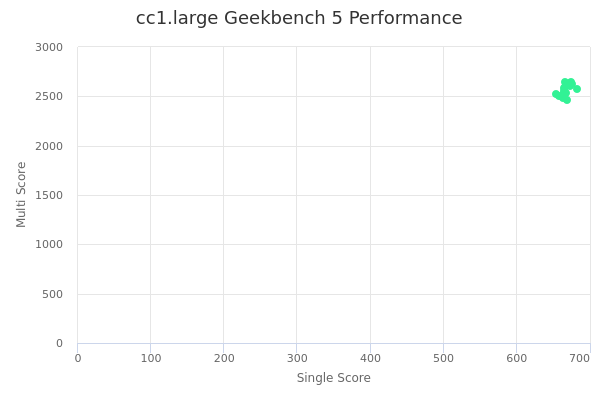
| Single | Multi | |
|---|---|---|
| Max | 683 | 2646 |
| Average | 668 | 2562 |
| Deviation | 6.22 | 57.17 |
| Min | 654 | 2462 |
Sign up as Freemium to get more insight.
- In same series
- cc1.xsmall
- cc1.small
- cc1.medium
- cc1.large
- cc1.xlarge
- cc1.2xlarge
- cc1.3xlarge
- cc1.4xlarge
- cc1.8xlarge