Dedicated 8Core 128GB Intel Skylake by IONOS
Geekbench is a cross-platform processor benchmark with a scoring system that determines single-core and multi-core performance using loads simulating real-world scenarios. Geekbench 5 score is calculated with a reference score of 2500 representing the performance of the Intel Core i5-2520M @ 2.50 GHz. The software benchmark is available for Mac OS, Windows, Linux, Android and iOS platforms.
Specifications:
CPU
16
RAM
128.0 GB
{
"configuration": {
"chart": {
"type": "scatter",
"polar": false,
"zoomType": "",
"options3d": {},
"height": null,
"width": null,
"margin": null,
"inverted": false,
"zooming": {}
},
"credits": {
"enabled": false
},
"title": {
"text": ""
},
"colorAxis": null,
"subtitle": {
"text": ""
},
"xAxis": {
"title": {
"text": [
"Single Score"
],
"useHTML": false,
"style": {
"color": "#666666"
}
},
"categories": null,
"lineWidth": 1,
"tickInterval": null,
"tickWidth": 1,
"tickLength": 10,
"tickPixelInterval": 100,
"plotLines": null,
"labels": {
"enabled": true,
"format": null,
"formatter": "",
"style": {
"color": "#666666",
"cursor": "default",
"fontSize": "11px"
},
"useHTML": false,
"step": 0
},
"plotBands": null,
"visible": true,
"floor": null,
"ceiling": null,
"type": "linear",
"min": 0,
"gridLineWidth": 1,
"gridLineColor": "#e6e6e6",
"minorTickInterval": null,
"minorTickWidth": 0,
"minTickInterval": null,
"startOnTick": true,
"endOnTick": true,
"tickmarkPlacement": 100,
"units": 100,
"minRange": 100
},
"yAxis": {
"title": {
"text": [
"Multi Score"
],
"useHTML": false,
"style": {
"color": "#666666"
}
},
"categories": null,
"plotLines": null,
"plotBands": null,
"lineWidth": null,
"tickInterval": null,
"tickLength": 10,
"floor": null,
"ceiling": null,
"gridLineInterpolation": null,
"gridLineWidth": 1,
"gridLineColor": "#e6e6e6",
"min": 0,
"max": null,
"minorTickInterval": null,
"minorTickWidth": 0,
"minTickInterval": null,
"startOnTick": true,
"endOnTick": true,
"minRange": null,
"type": "linear",
"tickmarkPlacement": null,
"labels": {
"enabled": true,
"formatter": null,
"style": {
"color": "#666666",
"cursor": "default",
"fontSize": "11px"
},
"useHTML": false
}
},
"zAxis": {
"title": {
"text": "Multi Score"
}
},
"plotOptions": {
"series": {
"dataLabels": {
"enabled": false,
"format": null,
"distance": 30,
"align": "center",
"inside": null,
"allowOverlap": false,
"style": {
"fontSize": "11px"
}
},
"showInLegend": null,
"turboThreshold": 0,
"stacking": "",
"groupPadding": 0.2,
"centerInCategory": false,
"findNearestPointBy": "x"
}
},
"navigator": {
"enabled": false
},
"scrollbar": {
"enabled": false
},
"rangeSelector": {
"enabled": false,
"inputEnabled": false
},
"legend": {
"enabled": null,
"maxHeight": null,
"align": "center",
"verticalAlign": "bottom",
"layout": "horizontal",
"width": null,
"margin": 12,
"reversed": false
},
"series": [
{
"name": "Dedicated 8Core 128GB Intel Skylake by IONOS",
"color": "#134094",
"data": [
{
"x": 1024.9569634311506,
"y": 8055.218492881189
},
{
"x": 954.0139054976562,
"y": 8023.441725223075
},
{
"x": 987.4885469393713,
"y": 8147.080785170418
},
{
"x": 940.1981758627651,
"y": 7978.767306429734
},
{
"x": 930.6101487176618,
"y": 8158.512748863181
},
{
"x": 943.112154085448,
"y": 8059.5536729660225
},
{
"x": 997.2158698385108,
"y": 8064.437456084364
},
{
"x": 960.5599479843961,
"y": 8095.308020545812
},
{
"x": 1003.96955481899,
"y": 8114.6780099992075
},
{
"x": 931.8882139251343,
"y": 7956.92975157183
},
{
"x": 1002.0075905057737,
"y": 8143.625992759012
},
{
"x": 927.7103891899367,
"y": 7983.326364746652
},
{
"x": 935.1946662113694,
"y": 8152.75792814928
},
{
"x": 935.0486313400004,
"y": 7995.768048806179
},
{
"x": 993.2751256625578,
"y": 8129.746667913114
},
{
"x": 926.6848614938431,
"y": 7919.813380554799
},
{
"x": 995.2111474496621,
"y": 8116.80573769454
},
{
"x": 931.6190764526698,
"y": 7994.72641882004
},
{
"x": 1001.3288011445761,
"y": 8159.261673215828
},
{
"x": 928.0261115975059,
"y": 8029.63112443219
},
{
"x": 1012.0183325377988,
"y": 8208.592078460064
},
{
"x": 962.3979542737551,
"y": 8305.468591486246
},
{
"x": 997.6238851328153,
"y": 8215.923330182293
},
{
"x": 958.1643718235825,
"y": 8281.625531864715
},
{
"x": 1003.3276890222696,
"y": 8196.050301968144
},
{
"x": 961.3673000346356,
"y": 8301.461028420203
},
{
"x": 1000.3951761352041,
"y": 8176.068849272246
},
{
"x": 962.7838286115327,
"y": 8273.352129044619
},
{
"x": 1002.1821278693674,
"y": 8209.252580201017
},
{
"x": 958.5272262201756,
"y": 8303.394540397336
},
{
"x": 995.9490825589437,
"y": 8158.043029406022
},
{
"x": 962.0591282920966,
"y": 8297.563429363025
},
{
"x": 999.3488406664221,
"y": 8199.918702378067
},
{
"x": 963.7824001436636,
"y": 8276.734929430999
},
{
"x": 1001.2773178849418,
"y": 8200.279071174878
},
{
"x": 959.2820537535468,
"y": 8311.136109698686
},
{
"x": 999.1451875790373,
"y": 8174.97524076521
},
{
"x": 961.6525243091819,
"y": 8306.369620518812
},
{
"x": 999.0445775310262,
"y": 8083.384030224291
},
{
"x": 961.3937792310951,
"y": 8297.83894933057
}
]
}
],
"drilldown": {},
"tooltip": {
"enabled": true,
"useHTML": false,
"format": null,
"headerFormat": "",
"pointFormat": "<span style=\"color:{series.color}\">Single</span>: <b>{point.x:.0f}</b><br><span style=\"color:{series.color}\">Multi</span>: <b>{point.y:.0f}</b>",
"footerFormat": "",
"shared": false,
"outside": false,
"valueDecimals": null,
"split": false
},
"annotations": null
},
"hc_type": "chart",
"id": "118530518333759331878200397088899536106"
}
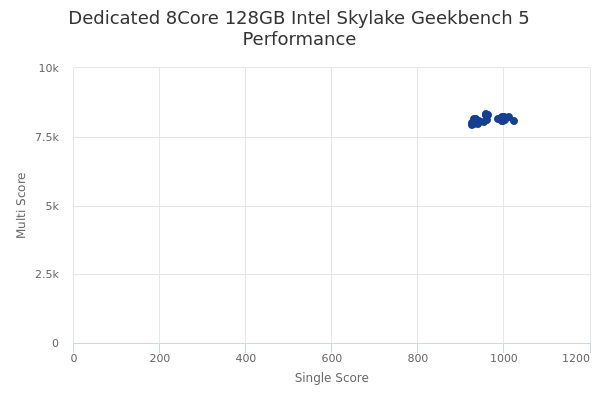
| Single | Multi | |
|---|---|---|
| Max | 1025 | 8311 |
| Average | 972 | 8151 |
| Deviation | 28.80 | 111.09 |
| Min | 927 | 7920 |
Sign up as Freemium to get more insight.
- In same series
- Dedicated 1Core 1GB Intel Skylake
- Dedicated 1Core 2GB Intel Skylake
- Dedicated 1Core 4GB Intel Skylake
- Dedicated 1Core 8GB Intel Skylake
- Dedicated 1Core 12GB Intel Skylake
- Dedicated 1Core 16GB Intel Skylake
- 1core 32GB Intel Skylake
- Dedicated 2Core 2GB Intel Skylake
- Dedicated 2Core 4GB Intel Skylake
- Dedicated 2Core 8GB Intel Skylake
- Dedicated 2Core 12GB Intel Skylake
- Dedicated 2Core 16GB Intel Skylake
- Dedicated 2Core 24GB Intel Skylake
- Dedicated 2Core 32GB Intel Skylake
- 2cores 64GB Intel Skylake
- Dedicated 4Core 4GB Intel Skylake
- Dedicated 4Core 8GB Intel Skylake
- Dedicated 4Core 12GB Intel Skylake
- Dedicated 4Core 16GB Intel Skylake
- Dedicated 4Core 24GB Intel Skylake
- Dedicated 4Core 32GB Intel Skylake
- Dedicated 4Core 48GB Intel Skylake
- Dedicated 4Core 64GB Intel Skylake
- 4cores 96GB Intel Skylake
- 4cores 128GB Intel Skylake
- 6cores 8GB Intel Skylake
- 6cores 16GB Intel Skylake
- 6cores 32GB Intel Skylake
- 6cores 64GB Intel Skylake
- 6cores 96GB Intel Skylake
- 6cores 128GB Intel Skylake
- 6cores 150GB Intel Skylake
- 6cores 192GB Intel Skylake
- Dedicated 8Core 8GB Intel Skylake
- Dedicated 8Core 12GB Intel Skylake
- Dedicated 8Core 16GB Intel Skylake
- Dedicated 8Core 24GB Intel Skylake
- Dedicated 8Core 32GB Intel Skylake
- Dedicated 8Core 48GB Intel Skylake
- Dedicated 8Core 64GB Intel Skylake
- 8cores 96GB Intel Skylake
- Dedicated 8Core 128GB Intel Skylake
- 8cores 150GB Intel Skylake
- 8cores 192GB Intel Skylake
- 8cores 256GB Intel Skylake
- 10cores 16GB Intel Skylake
- 10cores 32GB Intel Skylake
- 10cores 64GB Intel Skylake
- 10cores 96GB Intel Skylake
- 10cores 128GB Intel Skylake
- 10cores 150GB Intel Skylake
- 10cores 192GB Intel Skylake
- 10cores 256GB Intel Skylake
- Dedicated 12Core 12GB Intel Skylake
- Dedicated 12Core 16GB Intel Skylake
- Dedicated 12Core 24GB Intel Skylake
- Dedicated 12Core 32GB Intel Skylake
- Dedicated 12Core 48GB Intel Skylake
- Dedicated 12Core 64GB Intel Skylake
- 12cores 96GB Intel Skylake
- Dedicated 12Core 128GB Intel Skylake
- 12cores 150GB Intel Skylake
- Dedicated 12Core 192GB Intel Skylake
- 12cores 256GB Intel Skylake
- Dedicated 16Core 16GB Intel Skylake
- Dedicated 16Core 24GB Intel Skylake
- Dedicated 16Core 32GB Intel Skylake
- Dedicated 16Core 48GB Intel Skylake
- Dedicated 16Core 64GB Intel Skylake
- Dedicated 16Core 128GB Intel Skylake
- Dedicated 16Core 192GB Intel Skylake
- Dedicated 16Core 256GB Intel Skylake
- Dedicated 24Core 24GB Intel Skylake
- Dedicated 24Core 32GB Intel Skylake
- Dedicated 24Core 48GB Intel Skylake
- Dedicated 24Core 64GB Intel Skylake
- Dedicated 24Core 128GB Intel Skylake
- Dedicated 24Core 192GB Intel Skylake
- Dedicated 24Core 256GB Intel Skylake