Dedicated 1Core 2GB Intel Skylake by IONOS
Geekbench is a cross-platform processor benchmark with a scoring system that determines single-core and multi-core performance using loads simulating real-world scenarios. Geekbench 5 score is calculated with a reference score of 2500 representing the performance of the Intel Core i5-2520M @ 2.50 GHz. The software benchmark is available for Mac OS, Windows, Linux, Android and iOS platforms.
Specifications:
CPU
2
RAM
2.0 GB
{
"configuration": {
"chart": {
"type": "scatter",
"polar": false,
"zoomType": "",
"options3d": {},
"height": null,
"width": null,
"margin": null,
"inverted": false,
"zooming": {}
},
"credits": {
"enabled": false
},
"title": {
"text": ""
},
"colorAxis": null,
"subtitle": {
"text": ""
},
"xAxis": {
"title": {
"text": [
"Single Score"
],
"useHTML": false,
"style": {
"color": "#666666"
}
},
"categories": null,
"lineWidth": 1,
"tickInterval": null,
"tickWidth": 1,
"tickLength": 10,
"tickPixelInterval": 100,
"plotLines": null,
"labels": {
"enabled": true,
"format": null,
"formatter": "",
"style": {
"color": "#666666",
"cursor": "default",
"fontSize": "11px"
},
"useHTML": false,
"step": 0
},
"plotBands": null,
"visible": true,
"floor": null,
"ceiling": null,
"type": "linear",
"min": 0,
"gridLineWidth": 1,
"gridLineColor": "#e6e6e6",
"minorTickInterval": null,
"minorTickWidth": 0,
"minTickInterval": null,
"startOnTick": true,
"endOnTick": true,
"tickmarkPlacement": 100,
"units": 100,
"minRange": 100
},
"yAxis": {
"title": {
"text": [
"Multi Score"
],
"useHTML": false,
"style": {
"color": "#666666"
}
},
"categories": null,
"plotLines": null,
"plotBands": null,
"lineWidth": null,
"tickInterval": null,
"tickLength": 10,
"floor": null,
"ceiling": null,
"gridLineInterpolation": null,
"gridLineWidth": 1,
"gridLineColor": "#e6e6e6",
"min": 0,
"max": null,
"minorTickInterval": null,
"minorTickWidth": 0,
"minTickInterval": null,
"startOnTick": true,
"endOnTick": true,
"minRange": null,
"type": "linear",
"tickmarkPlacement": null,
"labels": {
"enabled": true,
"formatter": null,
"style": {
"color": "#666666",
"cursor": "default",
"fontSize": "11px"
},
"useHTML": false
}
},
"zAxis": {
"title": {
"text": "Multi Score"
}
},
"plotOptions": {
"series": {
"dataLabels": {
"enabled": false,
"format": null,
"distance": 30,
"align": "center",
"inside": null,
"allowOverlap": false,
"style": {
"fontSize": "11px"
}
},
"showInLegend": null,
"turboThreshold": 0,
"stacking": "",
"groupPadding": 0.2,
"centerInCategory": false,
"findNearestPointBy": "x"
}
},
"navigator": {
"enabled": false
},
"scrollbar": {
"enabled": false
},
"rangeSelector": {
"enabled": false,
"inputEnabled": false
},
"legend": {
"enabled": null,
"maxHeight": null,
"align": "center",
"verticalAlign": "bottom",
"layout": "horizontal",
"width": null,
"margin": 12,
"reversed": false
},
"series": [
{
"name": "Dedicated 1Core 2GB Intel Skylake by IONOS",
"color": "#134094",
"data": [
{
"x": 931.6255001724965,
"y": 1131.1913144392224
},
{
"x": 905.8243477660985,
"y": 1111.2996346290333
},
{
"x": 930.2399412845739,
"y": 1120.7793552451947
},
{
"x": 925.9341950485177,
"y": 1112.6454074567891
},
{
"x": 941.8198056777621,
"y": 1136.5579424636874
},
{
"x": 922.7267783400259,
"y": 1110.1698891477045
},
{
"x": 948.840037894213,
"y": 1150.5260009438055
},
{
"x": 933.6282081433725,
"y": 1116.6023840679948
},
{
"x": 950.6823915334792,
"y": 1137.0082418258467
},
{
"x": 918.7364753877448,
"y": 1115.307989086072
},
{
"x": 933.0797470765422,
"y": 1130.579826843656
},
{
"x": 925.1250763008579,
"y": 1116.079530379
},
{
"x": 933.7093299188016,
"y": 1130.6781326533157
},
{
"x": 929.5658481332837,
"y": 1110.5575173309498
},
{
"x": 935.0656329170207,
"y": 1127.9310592746388
},
{
"x": 919.5346892135052,
"y": 1113.5789909843181
},
{
"x": 934.1389360600301,
"y": 1133.9223619869895
},
{
"x": 928.0408279020589,
"y": 1129.0540150847205
},
{
"x": 936.5765183276383,
"y": 1132.7117876260859
},
{
"x": 937.0886676629023,
"y": 1099.6229502113015
}
]
}
],
"drilldown": {},
"tooltip": {
"enabled": true,
"useHTML": false,
"format": null,
"headerFormat": "",
"pointFormat": "<span style=\"color:{series.color}\">Single</span>: <b>{point.x:.0f}</b><br><span style=\"color:{series.color}\">Multi</span>: <b>{point.y:.0f}</b>",
"footerFormat": "",
"shared": false,
"outside": false,
"valueDecimals": null,
"split": false
},
"annotations": null
},
"hc_type": "chart",
"id": "48563391158332999290932109279424955928"
}
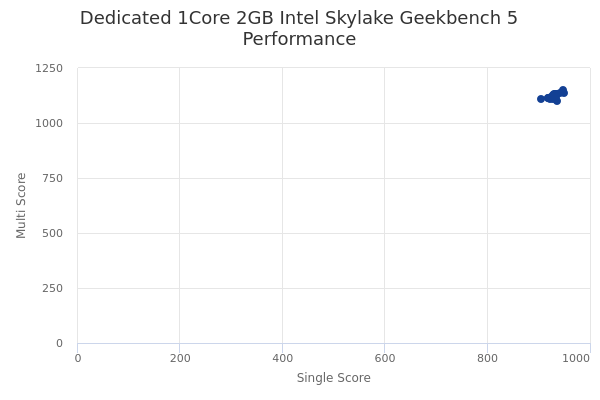
| Single | Multi | |
|---|---|---|
| Max | 951 | 1151 |
| Average | 931 | 1123 |
| Deviation | 9.98 | 12.14 |
| Min | 906 | 1100 |
Sign up as Freemium to get more insight.
- In same series
- Dedicated 1Core 1GB Intel Skylake
- Dedicated 1Core 2GB Intel Skylake
- Dedicated 1Core 4GB Intel Skylake
- Dedicated 1Core 8GB Intel Skylake
- Dedicated 1Core 12GB Intel Skylake
- Dedicated 1Core 16GB Intel Skylake
- 1core 32GB Intel Skylake
- Dedicated 2Core 2GB Intel Skylake
- Dedicated 2Core 4GB Intel Skylake
- Dedicated 2Core 8GB Intel Skylake
- Dedicated 2Core 12GB Intel Skylake
- Dedicated 2Core 16GB Intel Skylake
- Dedicated 2Core 24GB Intel Skylake
- Dedicated 2Core 32GB Intel Skylake
- 2cores 64GB Intel Skylake
- Dedicated 4Core 4GB Intel Skylake
- Dedicated 4Core 8GB Intel Skylake
- Dedicated 4Core 12GB Intel Skylake
- Dedicated 4Core 16GB Intel Skylake
- Dedicated 4Core 24GB Intel Skylake
- Dedicated 4Core 32GB Intel Skylake
- Dedicated 4Core 48GB Intel Skylake
- Dedicated 4Core 64GB Intel Skylake
- 4cores 96GB Intel Skylake
- 4cores 128GB Intel Skylake
- 6cores 8GB Intel Skylake
- 6cores 16GB Intel Skylake
- 6cores 32GB Intel Skylake
- 6cores 64GB Intel Skylake
- 6cores 96GB Intel Skylake
- 6cores 128GB Intel Skylake
- 6cores 150GB Intel Skylake
- 6cores 192GB Intel Skylake
- Dedicated 8Core 8GB Intel Skylake
- Dedicated 8Core 12GB Intel Skylake
- Dedicated 8Core 16GB Intel Skylake
- Dedicated 8Core 24GB Intel Skylake
- Dedicated 8Core 32GB Intel Skylake
- Dedicated 8Core 48GB Intel Skylake
- Dedicated 8Core 64GB Intel Skylake
- 8cores 96GB Intel Skylake
- Dedicated 8Core 128GB Intel Skylake
- 8cores 150GB Intel Skylake
- 8cores 192GB Intel Skylake
- 8cores 256GB Intel Skylake
- 10cores 16GB Intel Skylake
- 10cores 32GB Intel Skylake
- 10cores 64GB Intel Skylake
- 10cores 96GB Intel Skylake
- 10cores 128GB Intel Skylake
- 10cores 150GB Intel Skylake
- 10cores 192GB Intel Skylake
- 10cores 256GB Intel Skylake
- Dedicated 12Core 12GB Intel Skylake
- Dedicated 12Core 16GB Intel Skylake
- Dedicated 12Core 24GB Intel Skylake
- Dedicated 12Core 32GB Intel Skylake
- Dedicated 12Core 48GB Intel Skylake
- Dedicated 12Core 64GB Intel Skylake
- 12cores 96GB Intel Skylake
- Dedicated 12Core 128GB Intel Skylake
- 12cores 150GB Intel Skylake
- Dedicated 12Core 192GB Intel Skylake
- 12cores 256GB Intel Skylake
- Dedicated 16Core 16GB Intel Skylake
- Dedicated 16Core 24GB Intel Skylake
- Dedicated 16Core 32GB Intel Skylake
- Dedicated 16Core 48GB Intel Skylake
- Dedicated 16Core 64GB Intel Skylake
- Dedicated 16Core 128GB Intel Skylake
- Dedicated 16Core 192GB Intel Skylake
- Dedicated 16Core 256GB Intel Skylake
- Dedicated 24Core 24GB Intel Skylake
- Dedicated 24Core 32GB Intel Skylake
- Dedicated 24Core 48GB Intel Skylake
- Dedicated 24Core 64GB Intel Skylake
- Dedicated 24Core 128GB Intel Skylake
- Dedicated 24Core 192GB Intel Skylake
- Dedicated 24Core 256GB Intel Skylake