CPX21 by Hetzner
Geekbench is a cross-platform processor benchmark with a scoring system that determines single-core and multi-core performance using loads simulating real-world scenarios. Geekbench 5 score is calculated with a reference score of 2500 representing the performance of the Intel Core i5-2520M @ 2.50 GHz. The software benchmark is available for Mac OS, Windows, Linux, Android and iOS platforms.
Specifications:
CPU
3
RAM
4.0 GB
Root
80 GB
cpx21 Local
{
"configuration": {
"chart": {
"type": "scatter",
"polar": false,
"zoomType": "",
"options3d": {},
"height": null,
"width": null,
"margin": null,
"inverted": false,
"zooming": {}
},
"credits": {
"enabled": false
},
"title": {
"text": ""
},
"colorAxis": null,
"subtitle": {
"text": ""
},
"xAxis": {
"title": {
"text": [
"Single Score"
],
"useHTML": false,
"style": {
"color": "#666666"
}
},
"categories": null,
"lineWidth": 1,
"tickInterval": null,
"tickWidth": 1,
"tickLength": 10,
"tickPixelInterval": 100,
"plotLines": null,
"labels": {
"enabled": true,
"format": null,
"formatter": "",
"style": {
"color": "#666666",
"cursor": "default",
"fontSize": "11px"
},
"useHTML": false,
"step": 0
},
"plotBands": null,
"visible": true,
"floor": null,
"ceiling": null,
"type": "linear",
"min": 0,
"gridLineWidth": 1,
"gridLineColor": "#e6e6e6",
"minorTickInterval": null,
"minorTickWidth": 0,
"minTickInterval": null,
"startOnTick": true,
"endOnTick": true,
"tickmarkPlacement": 100,
"units": 100,
"minRange": 100
},
"yAxis": {
"title": {
"text": [
"Multi Score"
],
"useHTML": false,
"style": {
"color": "#666666"
}
},
"categories": null,
"plotLines": null,
"plotBands": null,
"lineWidth": null,
"tickInterval": null,
"tickLength": 10,
"floor": null,
"ceiling": null,
"gridLineInterpolation": null,
"gridLineWidth": 1,
"gridLineColor": "#e6e6e6",
"min": 0,
"max": null,
"minorTickInterval": null,
"minorTickWidth": 0,
"minTickInterval": null,
"startOnTick": true,
"endOnTick": true,
"minRange": null,
"type": "linear",
"tickmarkPlacement": null,
"labels": {
"enabled": true,
"formatter": null,
"style": {
"color": "#666666",
"cursor": "default",
"fontSize": "11px"
},
"useHTML": false
}
},
"zAxis": {
"title": {
"text": "Multi Score"
}
},
"plotOptions": {
"series": {
"dataLabels": {
"enabled": false,
"format": null,
"distance": 30,
"align": "center",
"inside": null,
"allowOverlap": false,
"style": {
"fontSize": "11px"
}
},
"showInLegend": null,
"turboThreshold": 0,
"stacking": "",
"groupPadding": 0.2,
"centerInCategory": false,
"findNearestPointBy": "x"
}
},
"navigator": {
"enabled": false
},
"scrollbar": {
"enabled": false
},
"rangeSelector": {
"enabled": false,
"inputEnabled": false
},
"legend": {
"enabled": null,
"maxHeight": null,
"align": "center",
"verticalAlign": "bottom",
"layout": "horizontal",
"width": null,
"margin": 12,
"reversed": false
},
"series": [
{
"name": "CPX21 by Hetzner",
"color": "#d5092d",
"data": [
{
"x": 580.9113389875922,
"y": 1485.6749698024455
},
{
"x": 617.0601422205925,
"y": 1512.7264819819175
},
{
"x": 597.8878350065567,
"y": 1555.9178823306813
},
{
"x": 549.2485865551029,
"y": 1447.1802198101063
},
{
"x": 593.5932945674944,
"y": 1550.0027725692535
},
{
"x": 568.1014849228702,
"y": 1443.394310927335
},
{
"x": 556.3584022956359,
"y": 1407.5200735769486
},
{
"x": 564.4086253838452,
"y": 1432.0146658019949
},
{
"x": 627.0937395316919,
"y": 1571.6116886432728
},
{
"x": 552.4673163297175,
"y": 1462.158542353888
},
{
"x": 552.7736918389955,
"y": 1462.7843373768376
},
{
"x": 553.3092869625349,
"y": 1403.4156447469218
},
{
"x": 550.4927932245656,
"y": 1467.3776235576302
},
{
"x": 552.0990958548405,
"y": 1453.7668978042218
},
{
"x": 530.1954569215852,
"y": 1470.183609418893
},
{
"x": 543.4559007772039,
"y": 1423.0136324208788
},
{
"x": 557.2284815675362,
"y": 1453.185068462785
},
{
"x": 561.9692166753254,
"y": 1454.5356493194245
},
{
"x": 562.0232325119376,
"y": 1468.097346628713
},
{
"x": 579.0342108316984,
"y": 1438.9262694006325
}
]
}
],
"drilldown": {},
"tooltip": {
"enabled": true,
"useHTML": false,
"format": null,
"headerFormat": "",
"pointFormat": "<span style=\"color:{series.color}\">Single</span>: <b>{point.x:.0f}</b><br><span style=\"color:{series.color}\">Multi</span>: <b>{point.y:.0f}</b>",
"footerFormat": "",
"shared": false,
"outside": false,
"valueDecimals": null,
"split": false
},
"annotations": null
},
"hc_type": "chart",
"id": "214359678385568928660074170290561510417"
}
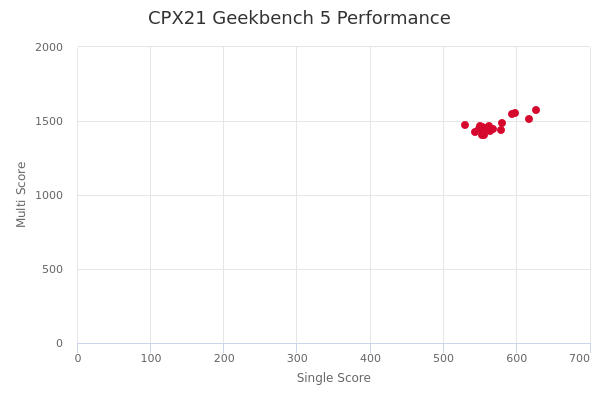
| Single | Multi | |
|---|---|---|
| Max | 627 | 1572 |
| Average | 567 | 1468 |
| Deviation | 24.19 | 45.39 |
| Min | 530 | 1403 |