CPX11 by Hetzner
Geekbench is a cross-platform processor benchmark with a scoring system that determines single-core and multi-core performance using loads simulating real-world scenarios. Geekbench 5 score is calculated with a reference score of 2500 representing the performance of the Intel Core i5-2520M @ 2.50 GHz. The software benchmark is available for Mac OS, Windows, Linux, Android and iOS platforms.
Specifications:
CPU
2
RAM
2.0 GB
Root
40 GB
cpx11 Local
{
"configuration": {
"chart": {
"type": "scatter",
"polar": false,
"zoomType": "",
"options3d": {},
"height": null,
"width": null,
"margin": null,
"inverted": false,
"zooming": {}
},
"credits": {
"enabled": false
},
"title": {
"text": ""
},
"colorAxis": null,
"subtitle": {
"text": ""
},
"xAxis": {
"title": {
"text": [
"Single Score"
],
"useHTML": false,
"style": {
"color": "#666666"
}
},
"categories": null,
"lineWidth": 1,
"tickInterval": null,
"tickWidth": 1,
"tickLength": 10,
"tickPixelInterval": 100,
"plotLines": null,
"labels": {
"enabled": true,
"format": null,
"formatter": "",
"style": {
"color": "#666666",
"cursor": "default",
"fontSize": "11px"
},
"useHTML": false,
"step": 0
},
"plotBands": null,
"visible": true,
"floor": null,
"ceiling": null,
"type": "linear",
"min": 0,
"gridLineWidth": 1,
"gridLineColor": "#e6e6e6",
"minorTickInterval": null,
"minorTickWidth": 0,
"minTickInterval": null,
"startOnTick": true,
"endOnTick": true,
"tickmarkPlacement": 100,
"units": 100,
"minRange": 100
},
"yAxis": {
"title": {
"text": [
"Multi Score"
],
"useHTML": false,
"style": {
"color": "#666666"
}
},
"categories": null,
"plotLines": null,
"plotBands": null,
"lineWidth": null,
"tickInterval": null,
"tickLength": 10,
"floor": null,
"ceiling": null,
"gridLineInterpolation": null,
"gridLineWidth": 1,
"gridLineColor": "#e6e6e6",
"min": 0,
"max": null,
"minorTickInterval": null,
"minorTickWidth": 0,
"minTickInterval": null,
"startOnTick": true,
"endOnTick": true,
"minRange": null,
"type": "linear",
"tickmarkPlacement": null,
"labels": {
"enabled": true,
"formatter": null,
"style": {
"color": "#666666",
"cursor": "default",
"fontSize": "11px"
},
"useHTML": false
}
},
"zAxis": {
"title": {
"text": "Multi Score"
}
},
"plotOptions": {
"series": {
"dataLabels": {
"enabled": false,
"format": null,
"distance": 30,
"align": "center",
"inside": null,
"allowOverlap": false,
"style": {
"fontSize": "11px"
}
},
"showInLegend": null,
"turboThreshold": 0,
"stacking": "",
"groupPadding": 0.2,
"centerInCategory": false,
"findNearestPointBy": "x"
}
},
"navigator": {
"enabled": false
},
"scrollbar": {
"enabled": false
},
"rangeSelector": {
"enabled": false,
"inputEnabled": false
},
"legend": {
"enabled": null,
"maxHeight": null,
"align": "center",
"verticalAlign": "bottom",
"layout": "horizontal",
"width": null,
"margin": 12,
"reversed": false
},
"series": [
{
"name": "CPX11 by Hetzner",
"color": "#d5092d",
"data": [
{
"x": 530.18366644054,
"y": 981.7421581985147
},
{
"x": 522.4863843947312,
"y": 972.9826709947602
},
{
"x": 536.2950151448941,
"y": 990.2268807338751
},
{
"x": 518.6797285758532,
"y": 981.8426728802249
},
{
"x": 543.8152070460678,
"y": 970.4930376688549
},
{
"x": 527.5926349828196,
"y": 973.065864205739
},
{
"x": 521.7496719528178,
"y": 967.3162825668633
},
{
"x": 508.08450890405993,
"y": 980.2681355920782
},
{
"x": 522.4963788723209,
"y": 981.642918683424
},
{
"x": 522.7375420413135,
"y": 980.3053523569397
},
{
"x": 520.4450626129508,
"y": 977.2750731273344
},
{
"x": 504.5538518608692,
"y": 968.8142275893521
},
{
"x": 526.6818972998318,
"y": 986.1636657126253
},
{
"x": 549.1735949012754,
"y": 961.7756832943146
},
{
"x": 544.0992435345403,
"y": 974.6206485283093
},
{
"x": 506.513644908203,
"y": 965.0547395248971
},
{
"x": 530.9938027983194,
"y": 988.8250577742981
},
{
"x": 523.8536329053373,
"y": 966.3686085368746
},
{
"x": 554.4069151783038,
"y": 976.1926283776327
},
{
"x": 538.8884752978645,
"y": 952.6201215371873
},
{
"x": 516.6329773124417,
"y": 934.8368963019249
},
{
"x": 509.4297620157793,
"y": 938.6152486604162
},
{
"x": 508.7921808991906,
"y": 950.9746635852056
},
{
"x": 497.08948991551654,
"y": 931.171190793774
},
{
"x": 503.69081166631656,
"y": 965.5420473555123
},
{
"x": 493.2567262428363,
"y": 949.084499506456
},
{
"x": 516.211101235248,
"y": 959.3011816514143
},
{
"x": 521.8650073392131,
"y": 936.508909576788
},
{
"x": 536.284675238292,
"y": 951.5954032645934
},
{
"x": 507.4796188405039,
"y": 937.1630107171987
}
]
}
],
"drilldown": {},
"tooltip": {
"enabled": true,
"useHTML": false,
"format": null,
"headerFormat": "",
"pointFormat": "<span style=\"color:{series.color}\">Single</span>: <b>{point.x:.0f}</b><br><span style=\"color:{series.color}\">Multi</span>: <b>{point.y:.0f}</b>",
"footerFormat": "",
"shared": false,
"outside": false,
"valueDecimals": null,
"split": false
},
"annotations": null
},
"hc_type": "chart",
"id": "319981453102070180572983660800040654874"
}
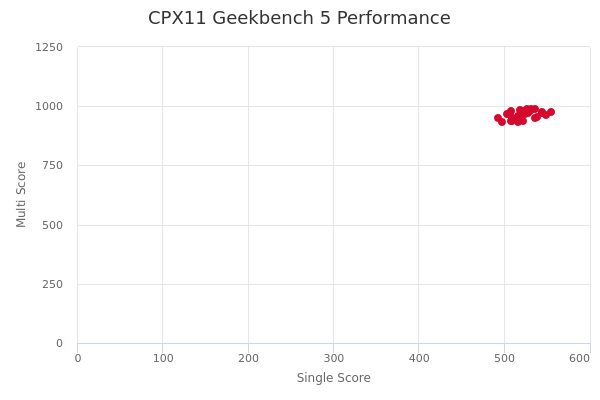
| Single | Multi | |
|---|---|---|
| Max | 554 | 990 |
| Average | 522 | 965 |
| Deviation | 15.04 | 17.00 |
| Min | 493 | 931 |