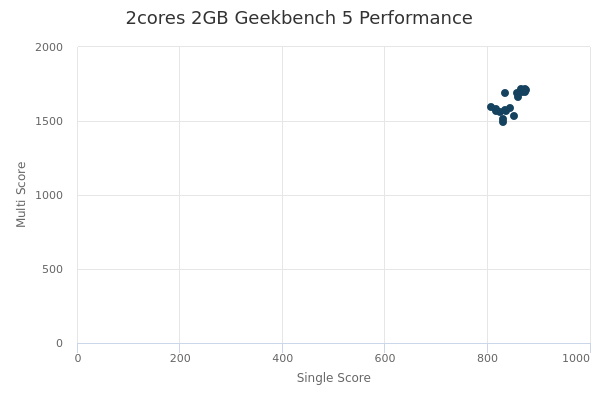
2cores 2GB by gridscale
Geekbench is a cross-platform processor benchmark with a scoring system that determines single-core and multi-core performance using loads simulating real-world scenarios. Geekbench 5 score is calculated with a reference score of 2500 representing the performance of the Intel Core i5-2520M @ 2.50 GHz. The software benchmark is available for Mac OS, Windows, Linux, Android and iOS platforms.
Specifications:
CPU
2
RAM
2.0 GB
{
"configuration": {
"chart": {
"type": "scatter",
"polar": false,
"zoomType": "",
"options3d": {},
"height": null,
"width": null,
"margin": null,
"inverted": false,
"zooming": {}
},
"credits": {
"enabled": false
},
"title": {
"text": ""
},
"colorAxis": null,
"subtitle": {
"text": ""
},
"xAxis": {
"title": {
"text": [
"Single Score"
],
"useHTML": false,
"style": {
"color": "#666666"
}
},
"categories": null,
"lineWidth": 1,
"tickInterval": null,
"tickWidth": 1,
"tickLength": 10,
"tickPixelInterval": 100,
"plotLines": null,
"labels": {
"enabled": true,
"format": null,
"formatter": "",
"style": {
"color": "#666666",
"cursor": "default",
"fontSize": "11px"
},
"useHTML": false,
"step": 0
},
"plotBands": null,
"visible": true,
"floor": null,
"ceiling": null,
"type": "linear",
"min": 0,
"gridLineWidth": 1,
"gridLineColor": "#e6e6e6",
"minorTickInterval": null,
"minorTickWidth": 0,
"minTickInterval": null,
"startOnTick": true,
"endOnTick": true,
"tickmarkPlacement": 100,
"units": 100,
"minRange": 100
},
"yAxis": {
"title": {
"text": [
"Multi Score"
],
"useHTML": false,
"style": {
"color": "#666666"
}
},
"categories": null,
"plotLines": null,
"plotBands": null,
"lineWidth": null,
"tickInterval": null,
"tickLength": 10,
"floor": null,
"ceiling": null,
"gridLineInterpolation": null,
"gridLineWidth": 1,
"gridLineColor": "#e6e6e6",
"min": 0,
"max": null,
"minorTickInterval": null,
"minorTickWidth": 0,
"minTickInterval": null,
"startOnTick": true,
"endOnTick": true,
"minRange": null,
"type": "linear",
"tickmarkPlacement": null,
"labels": {
"enabled": true,
"formatter": null,
"style": {
"color": "#666666",
"cursor": "default",
"fontSize": "11px"
},
"useHTML": false
}
},
"zAxis": {
"title": {
"text": "Multi Score"
}
},
"plotOptions": {
"series": {
"dataLabels": {
"enabled": false,
"format": null,
"distance": 30,
"align": "center",
"inside": null,
"allowOverlap": false,
"style": {
"fontSize": "11px"
}
},
"showInLegend": null,
"turboThreshold": 0,
"stacking": "",
"groupPadding": 0.2,
"centerInCategory": false,
"findNearestPointBy": "x"
}
},
"navigator": {
"enabled": false
},
"scrollbar": {
"enabled": false
},
"rangeSelector": {
"enabled": false,
"inputEnabled": false
},
"legend": {
"enabled": null,
"maxHeight": null,
"align": "center",
"verticalAlign": "bottom",
"layout": "horizontal",
"width": null,
"margin": 12,
"reversed": false
},
"series": [
{
"name": "2cores 2GB by gridscale",
"color": "#15425F",
"data": [
{
"x": 861.0075972329331,
"y": 1662.1830990798276
},
{
"x": 816.8620254785527,
"y": 1565.727167649755
},
{
"x": 858.9230232476492,
"y": 1688.948245706495
},
{
"x": 852.0899620904224,
"y": 1535.71367317618
},
{
"x": 866.9898600733962,
"y": 1699.6053724833569
},
{
"x": 830.2664991764273,
"y": 1512.6522047363933
},
{
"x": 834.5669509584925,
"y": 1689.3489887311393
},
{
"x": 830.416123567171,
"y": 1492.2971750526208
},
{
"x": 874.2406163747586,
"y": 1716.7014838345322
},
{
"x": 825.2844110325859,
"y": 1558.312079889125
},
{
"x": 874.2061420642256,
"y": 1698.5280285732483
},
{
"x": 817.8603727440068,
"y": 1578.1872198616581
},
{
"x": 873.9307799219466,
"y": 1709.8588798015571
},
{
"x": 808.2004828787309,
"y": 1594.417770682261
},
{
"x": 868.5497782816807,
"y": 1696.9560443871185
},
{
"x": 836.4170323295467,
"y": 1568.9146102635527
},
{
"x": 866.9665798849096,
"y": 1713.215927434536
},
{
"x": 844.388073558098,
"y": 1585.002265509941
},
{
"x": 875.1032052376894,
"y": 1712.3473423495361
},
{
"x": 835.8931022673113,
"y": 1574.8874345772406
}
]
}
],
"drilldown": {},
"tooltip": {
"enabled": true,
"useHTML": false,
"format": null,
"headerFormat": "",
"pointFormat": "<span style=\"color:{series.color}\">Single</span>: <b>{point.x:.0f}</b><br><span style=\"color:{series.color}\">Multi</span>: <b>{point.y:.0f}</b>",
"footerFormat": "",
"shared": false,
"outside": false,
"valueDecimals": null,
"split": false
},
"annotations": null
},
"hc_type": "chart",
"id": "78396052142185709064040866794372621716"
}
| Single | Multi | |
|---|---|---|
| Max | 875 | 1717 |
| Average | 848 | 1628 |
| Deviation | 21.57 | 75.23 |
| Min | 808 | 1492 |
Sign up as Freemium to get more insight.
- In same series
- 1core 1GB
- 1core 2GB
- 1core 4GB
- 1core 8GB
- 1core 16GB
- 2cores 2GB
- 2cores 4GB
- 2cores 8GB
- 2cores 16GB
- 2cores 24GB
- 2cores 32GB
- 3cores 4GB
- 3cores 8GB
- 3cores 16GB
- 3cores 24GB
- 3cores 32GB
- 3cores 48GB
- 4cores 4GB
- 4cores 8GB
- 4cores 16GB
- 4cores 24GB
- 4cores 32GB
- 4cores 48GB
- 4cores 64GB
- 6cores 8GB
- 6cores 16GB
- 6cores 24GB
- 6cores 32GB
- 6cores 48GB
- 6cores 64GB
- 6cores 96GB
- 8cores 8GB
- 8cores 16GB
- 8cores 24GB
- 8cores 32GB
- 8cores 48GB
- 8cores 64GB
- 8cores 96GB
- 8cores 128GB
- 12cores 16GB
- 12cores 24GB
- 12cores 32GB
- 12cores 48GB
- 12cores 64GB
- 12cores 96GB
- 12cores 128GB
- 12cores 168GB
- 12cores 192GB
- 16cores 16GB
- 16cores 24GB
- 16cores 32GB
- 16cores 48GB
- 16cores 64GB
- 16cores 96GB
- 16cores 128GB
- 16cores 168GB
- 16cores 192GB
- 24cores 24GB
- 24cores 32GB
- 24cores 48GB
- 24cores 64GB
- 24cores 96GB
- 24cores 128GB
- 24cores 168GB
- 24cores 192GB
- 32cores 32GB
- 32cores 48GB
- 32cores 64GB
- 32cores 96GB
- 32cores 128GB
- 32cores 168GB
- 32cores 192GB