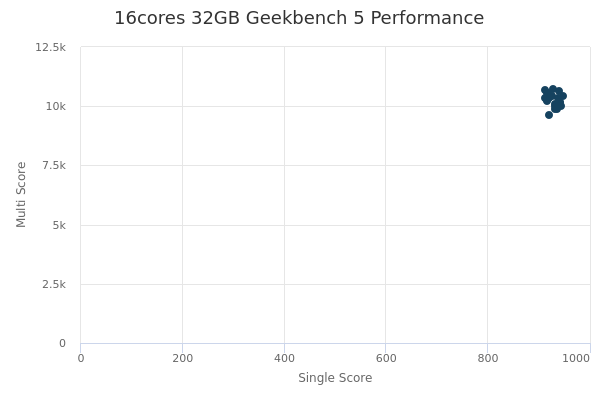
16cores 32GB by gridscale
Geekbench is a cross-platform processor benchmark with a scoring system that determines single-core and multi-core performance using loads simulating real-world scenarios. Geekbench 5 score is calculated with a reference score of 2500 representing the performance of the Intel Core i5-2520M @ 2.50 GHz. The software benchmark is available for Mac OS, Windows, Linux, Android and iOS platforms.
Specifications:
CPU
16
RAM
32.0 GB
{
"configuration": {
"chart": {
"type": "scatter",
"polar": false,
"zoomType": "",
"options3d": {},
"height": null,
"width": null,
"margin": null,
"inverted": false,
"zooming": {}
},
"credits": {
"enabled": false
},
"title": {
"text": ""
},
"colorAxis": null,
"subtitle": {
"text": ""
},
"xAxis": {
"title": {
"text": [
"Single Score"
],
"useHTML": false,
"style": {
"color": "#666666"
}
},
"categories": null,
"lineWidth": 1,
"tickInterval": null,
"tickWidth": 1,
"tickLength": 10,
"tickPixelInterval": 100,
"plotLines": null,
"labels": {
"enabled": true,
"format": null,
"formatter": "",
"style": {
"color": "#666666",
"cursor": "default",
"fontSize": "11px"
},
"useHTML": false,
"step": 0
},
"plotBands": null,
"visible": true,
"floor": null,
"ceiling": null,
"type": "linear",
"min": 0,
"gridLineWidth": 1,
"gridLineColor": "#e6e6e6",
"minorTickInterval": null,
"minorTickWidth": 0,
"minTickInterval": null,
"startOnTick": true,
"endOnTick": true,
"tickmarkPlacement": 100,
"units": 100,
"minRange": 100
},
"yAxis": {
"title": {
"text": [
"Multi Score"
],
"useHTML": false,
"style": {
"color": "#666666"
}
},
"categories": null,
"plotLines": null,
"plotBands": null,
"lineWidth": null,
"tickInterval": null,
"tickLength": 10,
"floor": null,
"ceiling": null,
"gridLineInterpolation": null,
"gridLineWidth": 1,
"gridLineColor": "#e6e6e6",
"min": 0,
"max": null,
"minorTickInterval": null,
"minorTickWidth": 0,
"minTickInterval": null,
"startOnTick": true,
"endOnTick": true,
"minRange": null,
"type": "linear",
"tickmarkPlacement": null,
"labels": {
"enabled": true,
"formatter": null,
"style": {
"color": "#666666",
"cursor": "default",
"fontSize": "11px"
},
"useHTML": false
}
},
"zAxis": {
"title": {
"text": "Multi Score"
}
},
"plotOptions": {
"series": {
"dataLabels": {
"enabled": false,
"format": null,
"distance": 30,
"align": "center",
"inside": null,
"allowOverlap": false,
"style": {
"fontSize": "11px"
}
},
"showInLegend": null,
"turboThreshold": 0,
"stacking": "",
"groupPadding": 0.2,
"centerInCategory": false,
"findNearestPointBy": "x"
}
},
"navigator": {
"enabled": false
},
"scrollbar": {
"enabled": false
},
"rangeSelector": {
"enabled": false,
"inputEnabled": false
},
"legend": {
"enabled": null,
"maxHeight": null,
"align": "center",
"verticalAlign": "bottom",
"layout": "horizontal",
"width": null,
"margin": 12,
"reversed": false
},
"series": [
{
"name": "16cores 32GB by gridscale",
"color": "#15425F",
"data": [
{
"x": 936.6760321311626,
"y": 9872.364138020137
},
{
"x": 931.9993215771926,
"y": 9871.253381022696
},
{
"x": 931.7138531529222,
"y": 10104.937692451671
},
{
"x": 920.5960371194376,
"y": 10349.617775401885
},
{
"x": 933.0300590791094,
"y": 9995.729553552714
},
{
"x": 928.5101967403978,
"y": 10722.286249356894
},
{
"x": 920.6166771790421,
"y": 9636.364435523703
},
{
"x": 917.0435806636227,
"y": 10247.659724380734
},
{
"x": 940.3081402842683,
"y": 10627.53165809187
},
{
"x": 925.8592782781054,
"y": 10409.92716359231
},
{
"x": 941.4543511531417,
"y": 10124.643770384153
},
{
"x": 912.2403954535755,
"y": 10674.198644142436
},
{
"x": 937.3403363222337,
"y": 10355.189160393114
},
{
"x": 912.8055916214331,
"y": 10333.651306421192
},
{
"x": 943.7236951463308,
"y": 10017.246713789225
},
{
"x": 916.396649352119,
"y": 10202.355667469892
},
{
"x": 947.376630556804,
"y": 10415.747633408117
},
{
"x": 915.5606414756688,
"y": 10555.658904629976
},
{
"x": 941.2666131667569,
"y": 10159.62272923777
},
{
"x": 917.9490877746949,
"y": 10568.103855196703
}
]
}
],
"drilldown": {},
"tooltip": {
"enabled": true,
"useHTML": false,
"format": null,
"headerFormat": "",
"pointFormat": "<span style=\"color:{series.color}\">Single</span>: <b>{point.x:.0f}</b><br><span style=\"color:{series.color}\">Multi</span>: <b>{point.y:.0f}</b>",
"footerFormat": "",
"shared": false,
"outside": false,
"valueDecimals": null,
"split": false
},
"annotations": null
},
"hc_type": "chart",
"id": "178199591679835210183972175250014386240"
}
| Single | Multi | |
|---|---|---|
| Max | 947 | 10722 |
| Average | 929 | 10262 |
| Deviation | 11.06 | 286.95 |
| Min | 912 | 9636 |
Sign up as Freemium to get more insight.
- In same series
- 1core 1GB
- 1core 2GB
- 1core 4GB
- 1core 8GB
- 1core 16GB
- 2cores 2GB
- 2cores 4GB
- 2cores 8GB
- 2cores 16GB
- 2cores 24GB
- 2cores 32GB
- 3cores 4GB
- 3cores 8GB
- 3cores 16GB
- 3cores 24GB
- 3cores 32GB
- 3cores 48GB
- 4cores 4GB
- 4cores 8GB
- 4cores 16GB
- 4cores 24GB
- 4cores 32GB
- 4cores 48GB
- 4cores 64GB
- 6cores 8GB
- 6cores 16GB
- 6cores 24GB
- 6cores 32GB
- 6cores 48GB
- 6cores 64GB
- 6cores 96GB
- 8cores 8GB
- 8cores 16GB
- 8cores 24GB
- 8cores 32GB
- 8cores 48GB
- 8cores 64GB
- 8cores 96GB
- 8cores 128GB
- 12cores 16GB
- 12cores 24GB
- 12cores 32GB
- 12cores 48GB
- 12cores 64GB
- 12cores 96GB
- 12cores 128GB
- 12cores 168GB
- 12cores 192GB
- 16cores 16GB
- 16cores 24GB
- 16cores 32GB
- 16cores 48GB
- 16cores 64GB
- 16cores 96GB
- 16cores 128GB
- 16cores 168GB
- 16cores 192GB
- 24cores 24GB
- 24cores 32GB
- 24cores 48GB
- 24cores 64GB
- 24cores 96GB
- 24cores 128GB
- 24cores 168GB
- 24cores 192GB
- 32cores 32GB
- 32cores 48GB
- 32cores 64GB
- 32cores 96GB
- 32cores 128GB
- 32cores 168GB
- 32cores 192GB