Custom E2 8 vCPU 16GB Intel Broadwell by Google Cloud
Geekbench is a cross-platform processor benchmark with a scoring system that determines single-core and multi-core performance using loads simulating real-world scenarios. Geekbench 5 score is calculated with a reference score of 2500 representing the performance of the Intel Core i5-2520M @ 2.50 GHz. The software benchmark is available for Mac OS, Windows, Linux, Android and iOS platforms.
Specifications:
CPU
8
RAM
16.0 GB
{
"configuration": {
"chart": {
"type": "scatter",
"polar": false,
"zoomType": "",
"options3d": {},
"height": null,
"width": null,
"margin": null,
"inverted": false,
"zooming": {}
},
"credits": {
"enabled": false
},
"title": {
"text": ""
},
"colorAxis": null,
"subtitle": {
"text": ""
},
"xAxis": {
"title": {
"text": [
"Single Score"
],
"useHTML": false,
"style": {
"color": "#666666"
}
},
"categories": null,
"lineWidth": 1,
"tickInterval": null,
"tickWidth": 1,
"tickLength": 10,
"tickPixelInterval": 100,
"plotLines": null,
"labels": {
"enabled": true,
"format": null,
"formatter": "",
"style": {
"color": "#666666",
"cursor": "default",
"fontSize": "11px"
},
"useHTML": false,
"step": 0
},
"plotBands": null,
"visible": true,
"floor": null,
"ceiling": null,
"type": "linear",
"min": 0,
"gridLineWidth": 1,
"gridLineColor": "#e6e6e6",
"minorTickInterval": null,
"minorTickWidth": 0,
"minTickInterval": null,
"startOnTick": true,
"endOnTick": true,
"tickmarkPlacement": 100,
"units": 100,
"minRange": 100
},
"yAxis": {
"title": {
"text": [
"Multi Score"
],
"useHTML": false,
"style": {
"color": "#666666"
}
},
"categories": null,
"plotLines": null,
"plotBands": null,
"lineWidth": null,
"tickInterval": null,
"tickLength": 10,
"floor": null,
"ceiling": null,
"gridLineInterpolation": null,
"gridLineWidth": 1,
"gridLineColor": "#e6e6e6",
"min": 0,
"max": null,
"minorTickInterval": null,
"minorTickWidth": 0,
"minTickInterval": null,
"startOnTick": true,
"endOnTick": true,
"minRange": null,
"type": "linear",
"tickmarkPlacement": null,
"labels": {
"enabled": true,
"formatter": null,
"style": {
"color": "#666666",
"cursor": "default",
"fontSize": "11px"
},
"useHTML": false
}
},
"zAxis": {
"title": {
"text": "Multi Score"
}
},
"plotOptions": {
"series": {
"dataLabels": {
"enabled": false,
"format": null,
"distance": 30,
"align": "center",
"inside": null,
"allowOverlap": false,
"style": {
"fontSize": "11px"
}
},
"showInLegend": null,
"turboThreshold": 0,
"stacking": "",
"groupPadding": 0.2,
"centerInCategory": false,
"findNearestPointBy": "x"
}
},
"navigator": {
"enabled": false
},
"scrollbar": {
"enabled": false
},
"rangeSelector": {
"enabled": false,
"inputEnabled": false
},
"legend": {
"enabled": null,
"maxHeight": null,
"align": "center",
"verticalAlign": "bottom",
"layout": "horizontal",
"width": null,
"margin": 12,
"reversed": false
},
"series": [
{
"name": "Custom E2 8 vCPU 16GB Intel Broadwell by Google Cloud",
"color": "#55b400",
"data": [
{
"x": 745.0120429838112,
"y": 3519.045690169114
},
{
"x": 730.4945636829382,
"y": 3459.716483258533
},
{
"x": 742.0489683553271,
"y": 3539.0687017978603
},
{
"x": 735.5570260295927,
"y": 3391.734004815442
},
{
"x": 749.0916699079188,
"y": 3534.3333717308615
},
{
"x": 728.6851781292396,
"y": 3480.1147554906856
},
{
"x": 739.031414126438,
"y": 3553.8637831007663
},
{
"x": 740.682304411453,
"y": 3471.429310317805
},
{
"x": 749.8964440705364,
"y": 3547.220865692959
},
{
"x": 719.8516648328491,
"y": 3379.5767861241766
},
{
"x": 747.92639128665,
"y": 3497.636331468694
},
{
"x": 724.9156971038838,
"y": 3408.8216150424505
},
{
"x": 740.5759188600356,
"y": 3480.58125017822
},
{
"x": 731.2985001340969,
"y": 3340.655647609667
},
{
"x": 742.403600015906,
"y": 3517.762065264419
},
{
"x": 714.2059459271014,
"y": 3434.094176184525
},
{
"x": 743.5895570246655,
"y": 3523.625780579407
},
{
"x": 742.9972562642156,
"y": 3423.362654776207
},
{
"x": 741.0798983469502,
"y": 3516.9450954536733
},
{
"x": 734.4516823780169,
"y": 3196.5773596286704
},
{
"x": 755.2047834295638,
"y": 3523.878660516974
},
{
"x": 734.1456037527993,
"y": 3443.3133011930404
},
{
"x": 757.0108580552173,
"y": 3548.4777526609632
},
{
"x": 734.8560918596393,
"y": 3468.4797027640834
},
{
"x": 762.7980073953022,
"y": 3558.616565837042
},
{
"x": 742.318087082981,
"y": 3488.940285326288
},
{
"x": 761.3220194328942,
"y": 3529.909780900057
},
{
"x": 735.7931594906399,
"y": 3472.011124534922
},
{
"x": 738.8800290020542,
"y": 3372.2220482108255
},
{
"x": 737.8966199489627,
"y": 3455.3761901437942
},
{
"x": 739.9872813731712,
"y": 3370.5245401187585
},
{
"x": 736.310010295883,
"y": 3491.923993309998
},
{
"x": 726.3570679794734,
"y": 3515.5426188896145
},
{
"x": 743.1133719722383,
"y": 3486.314145726259
},
{
"x": 767.2117698498171,
"y": 3574.7536821433405
},
{
"x": 741.7824898798062,
"y": 3502.7387562194153
},
{
"x": 769.3401503313097,
"y": 3567.6501245388654
},
{
"x": 742.065684970985,
"y": 3489.334391704034
},
{
"x": 767.200232460521,
"y": 3576.008814836973
},
{
"x": 737.4060885548525,
"y": 3459.9748791771
}
]
}
],
"drilldown": {},
"tooltip": {
"enabled": true,
"useHTML": false,
"format": null,
"headerFormat": "",
"pointFormat": "<span style=\"color:{series.color}\">Single</span>: <b>{point.x:.0f}</b><br><span style=\"color:{series.color}\">Multi</span>: <b>{point.y:.0f}</b>",
"footerFormat": "",
"shared": false,
"outside": false,
"valueDecimals": null,
"split": false
},
"annotations": null
},
"hc_type": "chart",
"id": "249538605848459151361365680601712423233"
}
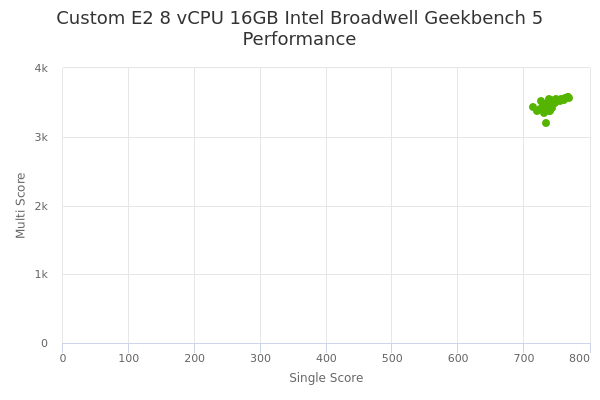
| Single | Multi | |
|---|---|---|
| Max | 769 | 3576 |
| Average | 742 | 3478 |
| Deviation | 12.20 | 74.28 |
| Min | 714 | 3197 |
Sign up as Freemium to get more insight.
- In same series
- Custom E2 2 vCPU 2GB Intel Broadwell
- Custom E2 2 vCPU 3GB Intel Broadwell
- Custom E2 2 vCPU 4GB Intel Broadwell
- Custom E2 2 vCPU 6GB Intel Broadwell
- Custom E2 2 vCPU 8GB Intel Broadwell
- Custom E2 2 vCPU 12GB Intel Broadwell
- Custom E2 2 vCPU 16GB Intel Broadwell
- Custom E2 4 vCPU 4GB Intel Broadwell
- Custom E2 4 vCPU 6GB Intel Broadwell
- Custom E2 4 vCPU 8GB Intel Broadwell
- Custom E2 4 vCPU 12GB Intel Broadwell
- Custom E2 4 vCPU 16GB Intel Broadwell
- Custom E2 4 vCPU 24GB Intel Broadwell
- Custom E2 4 vCPU 32GB Intel Broadwell
- Custom E2 6 vCPU 6GB Intel Broadwell
- Custom E2 6 vCPU 8GB Intel Broadwell
- Custom E2 6 vCPU 12GB Intel Broadwell
- Custom E2 6 vCPU 16GB Intel Broadwell
- Custom E2 6 vCPU 24GB Intel Broadwell
- Custom E2 6 vCPU 32GB Intel Broadwell
- Custom E2 6 vCPU 48GB Intel Broadwell
- Custom E2 8 vCPU 8GB Intel Broadwell
- Custom E2 8 vCPU 12GB Intel Broadwell
- Custom E2 8 vCPU 16GB Intel Broadwell
- Custom E2 8 vCPU 24GB Intel Broadwell
- Custom E2 8 vCPU 32GB Intel Broadwell
- Custom E2 8 vCPU 48GB Intel Broadwell
- Custom E2 8 vCPU 64GB Intel Broadwell
- Custom E2 10 vCPU 12GB Intel Broadwell
- Custom E2 10 vCPU 16GB Intel Broadwell
- Custom E2 10 vCPU 24GB Intel Broadwell
- Custom E2 10 vCPU 32GB Intel Broadwell
- Custom E2 10 vCPU 48GB Intel Broadwell
- Custom E2 10 vCPU 64GB Intel Broadwell
- Custom E2 12 vCPU 12GB Intel Broadwell
- Custom E2 12 vCPU 16GB Intel Broadwell
- Custom E2 12 vCPU 24GB Intel Broadwell
- Custom E2 12 vCPU 32GB Intel Broadwell
- Custom E2 12 vCPU 48GB Intel Broadwell
- Custom E2 12 vCPU 64GB Intel Broadwell
- Custom E2 12 vCPU 96GB Intel Broadwell
- Custom E2 16 vCPU 16GB Intel Broadwell
- Custom E2 16 vCPU 24GB Intel Broadwell
- Custom E2 16 vCPU 32GB Intel Broadwell
- Custom E2 16 vCPU 48GB Intel Broadwell
- Custom E2 16 vCPU 64GB Intel Broadwell
- Custom E2 16 vCPU 96GB Intel Broadwell
- Custom E2 16 vCPU 128GB Intel Broadwell
- Custom E2 20 vCPU 24GB Intel Broadwell
- Custom E2 20 vCPU 32GB Intel Broadwell
- Custom E2 20 vCPU 48GB Intel Broadwell
- Custom E2 20 vCPU 64GB Intel Broadwell
- Custom E2 20 vCPU 96GB Intel Broadwell
- Custom E2 20 vCPU 128GB Intel Broadwell
- Custom E2 24 vCPU 24GB Intel Broadwell
- Custom E2 24 vCPU 32GB Intel Broadwell
- Custom E2 24 vCPU 48GB Intel Broadwell
- Custom E2 24 vCPU 64GB Intel Broadwell
- Custom E2 24 vCPU 96GB Intel Broadwell
- Custom E2 24 vCPU 128GB Intel Broadwell
- Custom E2 28 vCPU 32GB Intel Broadwell
- Custom E2 28 vCPU 48GB Intel Broadwell
- Custom E2 28 vCPU 64GB Intel Broadwell
- Custom E2 28 vCPU 96GB Intel Broadwell
- Custom E2 28 vCPU 128GB Intel Broadwell
- Custom E2 32 vCPU 32GB Intel Broadwell
- Custom E2 32 vCPU 48GB Intel Broadwell
- Custom E2 32 vCPU 64GB Intel Broadwell
- Custom E2 32 vCPU 96GB Intel Broadwell
- Custom E2 32 vCPU 128GB Intel Broadwell