Custom E2 16 vCPU 32GB Intel Broadwell by Google Cloud
Geekbench is a cross-platform processor benchmark with a scoring system that determines single-core and multi-core performance using loads simulating real-world scenarios. Geekbench 5 score is calculated with a reference score of 2500 representing the performance of the Intel Core i5-2520M @ 2.50 GHz. The software benchmark is available for Mac OS, Windows, Linux, Android and iOS platforms.
Specifications:
CPU
16
RAM
32.0 GB
{
"configuration": {
"chart": {
"type": "scatter",
"polar": false,
"zoomType": "",
"options3d": {},
"height": null,
"width": null,
"margin": null,
"inverted": false,
"zooming": {}
},
"credits": {
"enabled": false
},
"title": {
"text": ""
},
"colorAxis": null,
"subtitle": {
"text": ""
},
"xAxis": {
"title": {
"text": [
"Single Score"
],
"useHTML": false,
"style": {
"color": "#666666"
}
},
"categories": null,
"lineWidth": 1,
"tickInterval": null,
"tickWidth": 1,
"tickLength": 10,
"tickPixelInterval": 100,
"plotLines": null,
"labels": {
"enabled": true,
"format": null,
"formatter": "",
"style": {
"color": "#666666",
"cursor": "default",
"fontSize": "11px"
},
"useHTML": false,
"step": 0
},
"plotBands": null,
"visible": true,
"floor": null,
"ceiling": null,
"type": "linear",
"min": 0,
"gridLineWidth": 1,
"gridLineColor": "#e6e6e6",
"minorTickInterval": null,
"minorTickWidth": 0,
"minTickInterval": null,
"startOnTick": true,
"endOnTick": true,
"tickmarkPlacement": 100,
"units": 100,
"minRange": 100
},
"yAxis": {
"title": {
"text": [
"Multi Score"
],
"useHTML": false,
"style": {
"color": "#666666"
}
},
"categories": null,
"plotLines": null,
"plotBands": null,
"lineWidth": null,
"tickInterval": null,
"tickLength": 10,
"floor": null,
"ceiling": null,
"gridLineInterpolation": null,
"gridLineWidth": 1,
"gridLineColor": "#e6e6e6",
"min": 0,
"max": null,
"minorTickInterval": null,
"minorTickWidth": 0,
"minTickInterval": null,
"startOnTick": true,
"endOnTick": true,
"minRange": null,
"type": "linear",
"tickmarkPlacement": null,
"labels": {
"enabled": true,
"formatter": null,
"style": {
"color": "#666666",
"cursor": "default",
"fontSize": "11px"
},
"useHTML": false
}
},
"zAxis": {
"title": {
"text": "Multi Score"
}
},
"plotOptions": {
"series": {
"dataLabels": {
"enabled": false,
"format": null,
"distance": 30,
"align": "center",
"inside": null,
"allowOverlap": false,
"style": {
"fontSize": "11px"
}
},
"showInLegend": null,
"turboThreshold": 0,
"stacking": "",
"groupPadding": 0.2,
"centerInCategory": false,
"findNearestPointBy": "x"
}
},
"navigator": {
"enabled": false
},
"scrollbar": {
"enabled": false
},
"rangeSelector": {
"enabled": false,
"inputEnabled": false
},
"legend": {
"enabled": null,
"maxHeight": null,
"align": "center",
"verticalAlign": "bottom",
"layout": "horizontal",
"width": null,
"margin": 12,
"reversed": false
},
"series": [
{
"name": "Custom E2 16 vCPU 32GB Intel Broadwell by Google Cloud",
"color": "#55b400",
"data": [
{
"x": 742.945518592941,
"y": 6543.859646494853
},
{
"x": 724.3701972583453,
"y": 6465.148400298299
},
{
"x": 747.1415866011674,
"y": 6533.199716679895
},
{
"x": 725.3282787113882,
"y": 6455.750477914164
},
{
"x": 745.6370924613811,
"y": 6546.2939607690805
},
{
"x": 726.3968481391043,
"y": 6483.545401766095
},
{
"x": 738.0177747111098,
"y": 6540.4245068017
},
{
"x": 718.9231124218562,
"y": 6498.383932122363
},
{
"x": 749.4063562220562,
"y": 6583.171228628054
},
{
"x": 729.3490773983102,
"y": 6531.260426129231
},
{
"x": 747.9517225444259,
"y": 6580.088018513604
},
{
"x": 727.6895113872885,
"y": 6529.189837581911
},
{
"x": 741.1088994522725,
"y": 6579.464365446722
},
{
"x": 727.8761619472423,
"y": 6505.47228714027
},
{
"x": 741.2975769337841,
"y": 6558.387912485396
},
{
"x": 727.6809256110901,
"y": 6482.903962554924
},
{
"x": 742.6218043410618,
"y": 6544.503221853007
},
{
"x": 725.2634895039429,
"y": 6497.552339220214
},
{
"x": 745.2181207049109,
"y": 6491.823663095477
},
{
"x": 727.4600326835689,
"y": 6480.100758345428
},
{
"x": 726.2659680541295,
"y": 6445.387259085101
},
{
"x": 720.1058036311185,
"y": 6313.36038168669
},
{
"x": 725.7921987900259,
"y": 6444.1887104198495
},
{
"x": 721.8282280136702,
"y": 6342.530338397945
},
{
"x": 723.1618672440163,
"y": 6400.827302230628
},
{
"x": 720.7580796714378,
"y": 6345.629416229249
},
{
"x": 722.8128212917022,
"y": 6339.134847565786
},
{
"x": 721.9088844625705,
"y": 6384.58945240991
},
{
"x": 725.2924681840245,
"y": 6422.1382530497285
},
{
"x": 720.1777171836711,
"y": 6373.513672618774
},
{
"x": 723.6149758305927,
"y": 6315.369572374842
},
{
"x": 720.7428456625863,
"y": 6327.41255095811
},
{
"x": 722.8081106281776,
"y": 6354.160486104099
},
{
"x": 719.2152698910531,
"y": 6363.454630577442
},
{
"x": 723.4692617895339,
"y": 6438.601387961958
},
{
"x": 719.1294071854236,
"y": 6307.67539251685
},
{
"x": 721.02773265397,
"y": 6410.598477289399
},
{
"x": 720.6452841599499,
"y": 6331.755215916321
},
{
"x": 721.0662514583596,
"y": 6388.547239659833
},
{
"x": 717.1792076535481,
"y": 6358.400928074476
}
]
}
],
"drilldown": {},
"tooltip": {
"enabled": true,
"useHTML": false,
"format": null,
"headerFormat": "",
"pointFormat": "<span style=\"color:{series.color}\">Single</span>: <b>{point.x:.0f}</b><br><span style=\"color:{series.color}\">Multi</span>: <b>{point.y:.0f}</b>",
"footerFormat": "",
"shared": false,
"outside": false,
"valueDecimals": null,
"split": false
},
"annotations": null
},
"hc_type": "chart",
"id": "331080003786686170925245549812976493632"
}
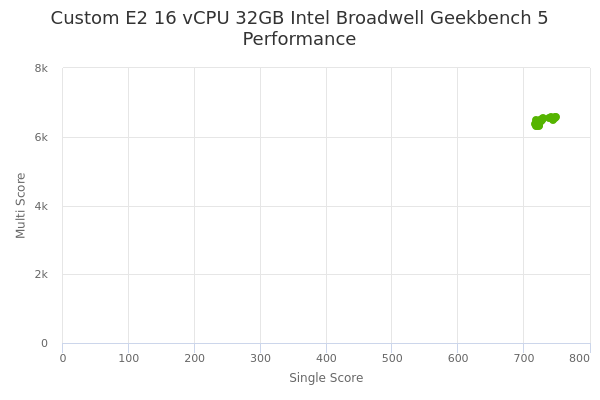
| Single | Multi | |
|---|---|---|
| Max | 749 | 6583 |
| Average | 728 | 6446 |
| Deviation | 9.59 | 85.88 |
| Min | 717 | 6308 |
Sign up as Freemium to get more insight.
- In same series
- Custom E2 2 vCPU 2GB Intel Broadwell
- Custom E2 2 vCPU 3GB Intel Broadwell
- Custom E2 2 vCPU 4GB Intel Broadwell
- Custom E2 2 vCPU 6GB Intel Broadwell
- Custom E2 2 vCPU 8GB Intel Broadwell
- Custom E2 2 vCPU 12GB Intel Broadwell
- Custom E2 2 vCPU 16GB Intel Broadwell
- Custom E2 4 vCPU 4GB Intel Broadwell
- Custom E2 4 vCPU 6GB Intel Broadwell
- Custom E2 4 vCPU 8GB Intel Broadwell
- Custom E2 4 vCPU 12GB Intel Broadwell
- Custom E2 4 vCPU 16GB Intel Broadwell
- Custom E2 4 vCPU 24GB Intel Broadwell
- Custom E2 4 vCPU 32GB Intel Broadwell
- Custom E2 6 vCPU 6GB Intel Broadwell
- Custom E2 6 vCPU 8GB Intel Broadwell
- Custom E2 6 vCPU 12GB Intel Broadwell
- Custom E2 6 vCPU 16GB Intel Broadwell
- Custom E2 6 vCPU 24GB Intel Broadwell
- Custom E2 6 vCPU 32GB Intel Broadwell
- Custom E2 6 vCPU 48GB Intel Broadwell
- Custom E2 8 vCPU 8GB Intel Broadwell
- Custom E2 8 vCPU 12GB Intel Broadwell
- Custom E2 8 vCPU 16GB Intel Broadwell
- Custom E2 8 vCPU 24GB Intel Broadwell
- Custom E2 8 vCPU 32GB Intel Broadwell
- Custom E2 8 vCPU 48GB Intel Broadwell
- Custom E2 8 vCPU 64GB Intel Broadwell
- Custom E2 10 vCPU 12GB Intel Broadwell
- Custom E2 10 vCPU 16GB Intel Broadwell
- Custom E2 10 vCPU 24GB Intel Broadwell
- Custom E2 10 vCPU 32GB Intel Broadwell
- Custom E2 10 vCPU 48GB Intel Broadwell
- Custom E2 10 vCPU 64GB Intel Broadwell
- Custom E2 12 vCPU 12GB Intel Broadwell
- Custom E2 12 vCPU 16GB Intel Broadwell
- Custom E2 12 vCPU 24GB Intel Broadwell
- Custom E2 12 vCPU 32GB Intel Broadwell
- Custom E2 12 vCPU 48GB Intel Broadwell
- Custom E2 12 vCPU 64GB Intel Broadwell
- Custom E2 12 vCPU 96GB Intel Broadwell
- Custom E2 16 vCPU 16GB Intel Broadwell
- Custom E2 16 vCPU 24GB Intel Broadwell
- Custom E2 16 vCPU 32GB Intel Broadwell
- Custom E2 16 vCPU 48GB Intel Broadwell
- Custom E2 16 vCPU 64GB Intel Broadwell
- Custom E2 16 vCPU 96GB Intel Broadwell
- Custom E2 16 vCPU 128GB Intel Broadwell
- Custom E2 20 vCPU 24GB Intel Broadwell
- Custom E2 20 vCPU 32GB Intel Broadwell
- Custom E2 20 vCPU 48GB Intel Broadwell
- Custom E2 20 vCPU 64GB Intel Broadwell
- Custom E2 20 vCPU 96GB Intel Broadwell
- Custom E2 20 vCPU 128GB Intel Broadwell
- Custom E2 24 vCPU 24GB Intel Broadwell
- Custom E2 24 vCPU 32GB Intel Broadwell
- Custom E2 24 vCPU 48GB Intel Broadwell
- Custom E2 24 vCPU 64GB Intel Broadwell
- Custom E2 24 vCPU 96GB Intel Broadwell
- Custom E2 24 vCPU 128GB Intel Broadwell
- Custom E2 28 vCPU 32GB Intel Broadwell
- Custom E2 28 vCPU 48GB Intel Broadwell
- Custom E2 28 vCPU 64GB Intel Broadwell
- Custom E2 28 vCPU 96GB Intel Broadwell
- Custom E2 28 vCPU 128GB Intel Broadwell
- Custom E2 32 vCPU 32GB Intel Broadwell
- Custom E2 32 vCPU 48GB Intel Broadwell
- Custom E2 32 vCPU 64GB Intel Broadwell
- Custom E2 32 vCPU 96GB Intel Broadwell
- Custom E2 32 vCPU 128GB Intel Broadwell