w6asx.5xlarge by Genesis Hosting Solutions
Geekbench is a cross-platform processor benchmark with a scoring system that determines single-core and multi-core performance using loads simulating real-world scenarios. Geekbench 5 score is calculated with a reference score of 2500 representing the performance of the Intel Core i5-2520M @ 2.50 GHz. The software benchmark is available for Mac OS, Windows, Linux, Android and iOS platforms.
Specifications:
CPU
10
RAM
20.0 GB
Root
1000 GB
Root w6asx.5xlarge
{
"configuration": {
"chart": {
"type": "scatter",
"polar": false,
"zoomType": "",
"options3d": {},
"height": null,
"width": null,
"margin": null,
"inverted": false,
"zooming": {}
},
"credits": {
"enabled": false
},
"title": {
"text": ""
},
"colorAxis": null,
"subtitle": {
"text": ""
},
"xAxis": {
"title": {
"text": [
"Single Score"
],
"useHTML": false,
"style": {
"color": "#666666"
}
},
"categories": null,
"lineWidth": 1,
"tickInterval": null,
"tickWidth": 1,
"tickLength": 10,
"tickPixelInterval": 100,
"plotLines": null,
"labels": {
"enabled": true,
"format": null,
"formatter": "",
"style": {
"color": "#666666",
"cursor": "default",
"fontSize": "11px"
},
"useHTML": false,
"step": 0
},
"plotBands": null,
"visible": true,
"floor": null,
"ceiling": null,
"type": "linear",
"min": 0,
"gridLineWidth": 1,
"gridLineColor": "#e6e6e6",
"minorTickInterval": null,
"minorTickWidth": 0,
"minTickInterval": null,
"startOnTick": true,
"endOnTick": true,
"tickmarkPlacement": 100,
"units": 100,
"minRange": 100
},
"yAxis": {
"title": {
"text": [
"Multi Score"
],
"useHTML": false,
"style": {
"color": "#666666"
}
},
"categories": null,
"plotLines": null,
"plotBands": null,
"lineWidth": null,
"tickInterval": null,
"tickLength": 10,
"floor": null,
"ceiling": null,
"gridLineInterpolation": null,
"gridLineWidth": 1,
"gridLineColor": "#e6e6e6",
"min": 0,
"max": null,
"minorTickInterval": null,
"minorTickWidth": 0,
"minTickInterval": null,
"startOnTick": true,
"endOnTick": true,
"minRange": null,
"type": "linear",
"tickmarkPlacement": null,
"labels": {
"enabled": true,
"formatter": null,
"style": {
"color": "#666666",
"cursor": "default",
"fontSize": "11px"
},
"useHTML": false
}
},
"zAxis": {
"title": {
"text": "Multi Score"
}
},
"plotOptions": {
"series": {
"dataLabels": {
"enabled": false,
"format": null,
"distance": 30,
"align": "center",
"inside": null,
"allowOverlap": false,
"style": {
"fontSize": "11px"
}
},
"showInLegend": null,
"turboThreshold": 0,
"stacking": "",
"groupPadding": 0.2,
"centerInCategory": false,
"findNearestPointBy": "x"
}
},
"navigator": {
"enabled": false
},
"scrollbar": {
"enabled": false
},
"rangeSelector": {
"enabled": false,
"inputEnabled": false
},
"legend": {
"enabled": null,
"maxHeight": null,
"align": "center",
"verticalAlign": "bottom",
"layout": "horizontal",
"width": null,
"margin": 12,
"reversed": false
},
"series": [
{
"name": "w6asx.5xlarge by Genesis Hosting Solutions",
"color": "#c16b28",
"data": [
{
"x": 1019.1118246230599,
"y": 7695.443346764011
},
{
"x": 1025.1084215443414,
"y": 7526.704197466657
},
{
"x": 1002.2844289803224,
"y": 7688.862785725722
},
{
"x": 1010.9977276239704,
"y": 7544.415038651854
},
{
"x": 1004.1482908602738,
"y": 7298.007125595009
},
{
"x": 1001.3993644978369,
"y": 7553.561312756824
},
{
"x": 1005.2571078867936,
"y": 8069.516430808939
},
{
"x": 999.037045985035,
"y": 8132.0480254240065
},
{
"x": 1011.8677297999136,
"y": 7691.272822932789
},
{
"x": 1000.2624019480048,
"y": 7992.750199769504
},
{
"x": 1012.2379741116126,
"y": 7540.699241118227
},
{
"x": 1011.4966964736834,
"y": 7678.286467309245
},
{
"x": 999.2976264462106,
"y": 7481.158679871363
},
{
"x": 1004.2278518528317,
"y": 7521.212899800417
},
{
"x": 1008.8518533413744,
"y": 7799.4163593220055
},
{
"x": 1006.0297014268701,
"y": 7979.327342723165
},
{
"x": 1002.7214605926108,
"y": 7781.486558578197
},
{
"x": 1004.0427504311538,
"y": 7710.383549054286
},
{
"x": 1000.632308897153,
"y": 7688.0061504761325
},
{
"x": 998.5708355934123,
"y": 7243.289741679895
}
]
}
],
"drilldown": {},
"tooltip": {
"enabled": true,
"useHTML": false,
"format": null,
"headerFormat": "",
"pointFormat": "<span style=\"color:{series.color}\">Single</span>: <b>{point.x:.0f}</b><br><span style=\"color:{series.color}\">Multi</span>: <b>{point.y:.0f}</b>",
"footerFormat": "",
"shared": false,
"outside": false,
"valueDecimals": null,
"split": false
},
"annotations": null
},
"hc_type": "chart",
"id": "166168983474532214955793647244205171952"
}
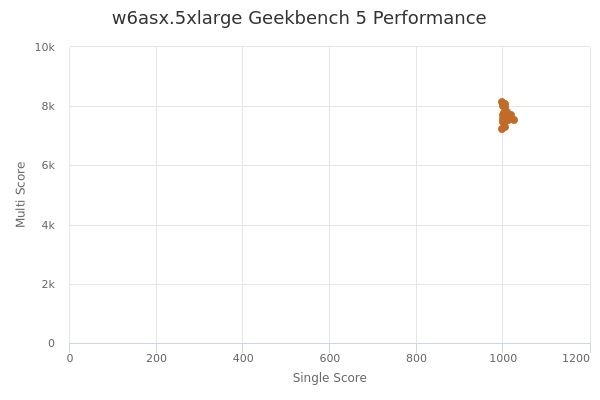
| Single | Multi | |
|---|---|---|
| Max | 1025 | 8132 |
| Average | 1006 | 7681 |
| Deviation | 6.85 | 228.92 |
| Min | 999 | 7243 |
Sign up as Freemium to get more insight.