w6asx.4xlarge by Genesis Hosting Solutions
Geekbench is a cross-platform processor benchmark with a scoring system that determines single-core and multi-core performance using loads simulating real-world scenarios. Geekbench 5 score is calculated with a reference score of 2500 representing the performance of the Intel Core i5-2520M @ 2.50 GHz. The software benchmark is available for Mac OS, Windows, Linux, Android and iOS platforms.
Specifications:
CPU
8
RAM
16.0 GB
Root
800 GB
Root w6asx.4xlarge
{
"configuration": {
"chart": {
"type": "scatter",
"polar": false,
"zoomType": "",
"options3d": {},
"height": null,
"width": null,
"margin": null,
"inverted": false,
"zooming": {}
},
"credits": {
"enabled": false
},
"title": {
"text": ""
},
"colorAxis": null,
"subtitle": {
"text": ""
},
"xAxis": {
"title": {
"text": [
"Single Score"
],
"useHTML": false,
"style": {
"color": "#666666"
}
},
"categories": null,
"lineWidth": 1,
"tickInterval": null,
"tickWidth": 1,
"tickLength": 10,
"tickPixelInterval": 100,
"plotLines": null,
"labels": {
"enabled": true,
"format": null,
"formatter": "",
"style": {
"color": "#666666",
"cursor": "default",
"fontSize": "11px"
},
"useHTML": false,
"step": 0
},
"plotBands": null,
"visible": true,
"floor": null,
"ceiling": null,
"type": "linear",
"min": 0,
"gridLineWidth": 1,
"gridLineColor": "#e6e6e6",
"minorTickInterval": null,
"minorTickWidth": 0,
"minTickInterval": null,
"startOnTick": true,
"endOnTick": true,
"tickmarkPlacement": 100,
"units": 100,
"minRange": 100
},
"yAxis": {
"title": {
"text": [
"Multi Score"
],
"useHTML": false,
"style": {
"color": "#666666"
}
},
"categories": null,
"plotLines": null,
"plotBands": null,
"lineWidth": null,
"tickInterval": null,
"tickLength": 10,
"floor": null,
"ceiling": null,
"gridLineInterpolation": null,
"gridLineWidth": 1,
"gridLineColor": "#e6e6e6",
"min": 0,
"max": null,
"minorTickInterval": null,
"minorTickWidth": 0,
"minTickInterval": null,
"startOnTick": true,
"endOnTick": true,
"minRange": null,
"type": "linear",
"tickmarkPlacement": null,
"labels": {
"enabled": true,
"formatter": null,
"style": {
"color": "#666666",
"cursor": "default",
"fontSize": "11px"
},
"useHTML": false
}
},
"zAxis": {
"title": {
"text": "Multi Score"
}
},
"plotOptions": {
"series": {
"dataLabels": {
"enabled": false,
"format": null,
"distance": 30,
"align": "center",
"inside": null,
"allowOverlap": false,
"style": {
"fontSize": "11px"
}
},
"showInLegend": null,
"turboThreshold": 0,
"stacking": "",
"groupPadding": 0.2,
"centerInCategory": false,
"findNearestPointBy": "x"
}
},
"navigator": {
"enabled": false
},
"scrollbar": {
"enabled": false
},
"rangeSelector": {
"enabled": false,
"inputEnabled": false
},
"legend": {
"enabled": null,
"maxHeight": null,
"align": "center",
"verticalAlign": "bottom",
"layout": "horizontal",
"width": null,
"margin": 12,
"reversed": false
},
"series": [
{
"name": "w6asx.4xlarge by Genesis Hosting Solutions",
"color": "#c16b28",
"data": [
{
"x": 1003.9503701488748,
"y": 6057.176076991598
},
{
"x": 1010.7949195128906,
"y": 6124.337808866433
},
{
"x": 1010.3256481413518,
"y": 5911.72251758347
},
{
"x": 1005.7205854674922,
"y": 6170.840865179327
},
{
"x": 998.6885987080082,
"y": 6139.175224689984
},
{
"x": 1008.7624473522762,
"y": 5843.918957928362
},
{
"x": 994.371523570391,
"y": 6224.321843353811
},
{
"x": 997.5914063217423,
"y": 6105.60265159377
},
{
"x": 1014.1806465023624,
"y": 6307.691864334434
},
{
"x": 1006.0018532417278,
"y": 6329.552052888504
},
{
"x": 1013.5028753033625,
"y": 6060.289541194846
},
{
"x": 1007.1054940919018,
"y": 6433.133058277959
},
{
"x": 996.9628017530459,
"y": 6496.133126735503
},
{
"x": 991.4165104941642,
"y": 6395.693487410279
},
{
"x": 1016.8174670056148,
"y": 6273.164080187113
},
{
"x": 1009.5453740153971,
"y": 6278.2347579271645
},
{
"x": 1011.0309803402922,
"y": 6455.5729475060725
},
{
"x": 1000.086017581753,
"y": 6291.235332362949
},
{
"x": 1006.9047388431798,
"y": 6418.3908818404725
},
{
"x": 993.1252278068416,
"y": 6441.994172882715
}
]
}
],
"drilldown": {},
"tooltip": {
"enabled": true,
"useHTML": false,
"format": null,
"headerFormat": "",
"pointFormat": "<span style=\"color:{series.color}\">Single</span>: <b>{point.x:.0f}</b><br><span style=\"color:{series.color}\">Multi</span>: <b>{point.y:.0f}</b>",
"footerFormat": "",
"shared": false,
"outside": false,
"valueDecimals": null,
"split": false
},
"annotations": null
},
"hc_type": "chart",
"id": "75369717476451528033770394841934256402"
}
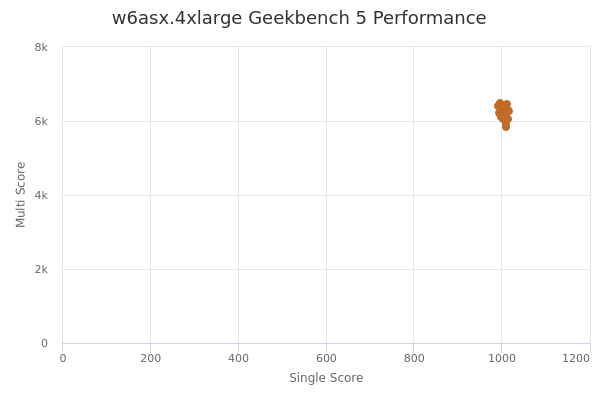
| Single | Multi | |
|---|---|---|
| Max | 1017 | 6496 |
| Average | 1005 | 6238 |
| Deviation | 7.29 | 179.02 |
| Min | 991 | 5844 |
Sign up as Freemium to get more insight.