g1-cpu-4-4 by G-Core
Geekbench is a cross-platform processor benchmark with a scoring system that determines single-core and multi-core performance using loads simulating real-world scenarios. Geekbench 5 score is calculated with a reference score of 2500 representing the performance of the Intel Core i5-2520M @ 2.50 GHz. The software benchmark is available for Mac OS, Windows, Linux, Android and iOS platforms.
Specifications:
CPU
4
RAM
4.0 GB
{
"configuration": {
"chart": {
"type": "scatter",
"polar": false,
"zoomType": "",
"options3d": {},
"height": null,
"width": null,
"margin": null,
"inverted": false,
"zooming": {}
},
"credits": {
"enabled": false
},
"title": {
"text": ""
},
"colorAxis": null,
"subtitle": {
"text": ""
},
"xAxis": {
"title": {
"text": [
"Single Score"
],
"useHTML": false,
"style": {
"color": "#666666"
}
},
"categories": null,
"lineWidth": 1,
"tickInterval": null,
"tickWidth": 1,
"tickLength": 10,
"tickPixelInterval": 100,
"plotLines": null,
"labels": {
"enabled": true,
"format": null,
"formatter": "",
"style": {
"color": "#666666",
"cursor": "default",
"fontSize": "11px"
},
"useHTML": false,
"step": 0
},
"plotBands": null,
"visible": true,
"floor": null,
"ceiling": null,
"type": "linear",
"min": 0,
"gridLineWidth": 1,
"gridLineColor": "#e6e6e6",
"minorTickInterval": null,
"minorTickWidth": 0,
"minTickInterval": null,
"startOnTick": true,
"endOnTick": true,
"tickmarkPlacement": 100,
"units": 100,
"minRange": 100
},
"yAxis": {
"title": {
"text": [
"Multi Score"
],
"useHTML": false,
"style": {
"color": "#666666"
}
},
"categories": null,
"plotLines": null,
"plotBands": null,
"lineWidth": null,
"tickInterval": null,
"tickLength": 10,
"floor": null,
"ceiling": null,
"gridLineInterpolation": null,
"gridLineWidth": 1,
"gridLineColor": "#e6e6e6",
"min": 0,
"max": null,
"minorTickInterval": null,
"minorTickWidth": 0,
"minTickInterval": null,
"startOnTick": true,
"endOnTick": true,
"minRange": null,
"type": "linear",
"tickmarkPlacement": null,
"labels": {
"enabled": true,
"formatter": null,
"style": {
"color": "#666666",
"cursor": "default",
"fontSize": "11px"
},
"useHTML": false
}
},
"zAxis": {
"title": {
"text": "Multi Score"
}
},
"plotOptions": {
"series": {
"dataLabels": {
"enabled": false,
"format": null,
"distance": 30,
"align": "center",
"inside": null,
"allowOverlap": false,
"style": {
"fontSize": "11px"
}
},
"showInLegend": null,
"turboThreshold": 0,
"stacking": "",
"groupPadding": 0.2,
"centerInCategory": false,
"findNearestPointBy": "x"
}
},
"navigator": {
"enabled": false
},
"scrollbar": {
"enabled": false
},
"rangeSelector": {
"enabled": false,
"inputEnabled": false
},
"legend": {
"enabled": null,
"maxHeight": null,
"align": "center",
"verticalAlign": "bottom",
"layout": "horizontal",
"width": null,
"margin": 12,
"reversed": false
},
"series": [
{
"name": "g1-cpu-4-4 by G-Core",
"color": "#F5580F",
"data": [
{
"x": 645.7050131863285,
"y": 2266.325960354208
},
{
"x": 575.3458917109352,
"y": 1920.2903724669432
},
{
"x": 656.063305624301,
"y": 2244.295947472685
},
{
"x": 590.3073630113572,
"y": 1860.0632898547074
},
{
"x": 642.8139030534636,
"y": 2253.8908890261823
},
{
"x": 580.0734261250605,
"y": 1807.1565486383151
},
{
"x": 633.4588403142269,
"y": 2309.1123467867246
},
{
"x": 549.1436806881551,
"y": 1872.8505137302232
},
{
"x": 655.1493185886558,
"y": 2235.0697570602288
},
{
"x": 588.8443996938346,
"y": 1811.6868725072254
},
{
"x": 625.8243727492651,
"y": 2321.5474987974444
},
{
"x": 589.9513774229958,
"y": 1907.6710408153704
},
{
"x": 636.6997895658747,
"y": 2393.619463863162
},
{
"x": 577.1721952840335,
"y": 1919.3289052494752
},
{
"x": 630.9233700629769,
"y": 2354.2440860292636
},
{
"x": 605.937783900622,
"y": 1978.53560162796
},
{
"x": 647.40071777718,
"y": 2309.166984902061
},
{
"x": 635.1626109630174,
"y": 2312.9146483054533
},
{
"x": 577.7650968305912,
"y": 1806.692883989049
},
{
"x": 548.7405945855074,
"y": 1881.5941134162524
},
{
"x": 1018.8974024578315,
"y": 3803.1658192463183
},
{
"x": 972.8239429164191,
"y": 3637.9030932404085
},
{
"x": 1026.776975829485,
"y": 3784.3925503971095
},
{
"x": 976.2546632454589,
"y": 3622.249737995159
},
{
"x": 1029.2218483302686,
"y": 3839.818179401896
},
{
"x": 966.2983552732137,
"y": 3652.180051297867
},
{
"x": 1033.0403862472092,
"y": 3842.374811282044
},
{
"x": 965.6586906891796,
"y": 3581.7853869303794
},
{
"x": 1023.0453294186893,
"y": 3722.0105190968607
},
{
"x": 970.850769869194,
"y": 3597.241166130961
},
{
"x": 1019.527942144121,
"y": 3748.585504546538
},
{
"x": 969.0186009133836,
"y": 3614.2862970357837
},
{
"x": 1018.2235162450376,
"y": 3799.8205681859686
},
{
"x": 976.0879290721439,
"y": 3609.9647298360037
},
{
"x": 1018.4879202062566,
"y": 3788.8430121607335
},
{
"x": 982.883105748481,
"y": 3617.4923907357534
},
{
"x": 1002.364647335038,
"y": 3769.7580524391506
},
{
"x": 989.1570392598353,
"y": 3630.465006079644
},
{
"x": 1027.8194818106351,
"y": 3813.9879523336917
},
{
"x": 977.7936520253529,
"y": 3657.916050841126
}
]
}
],
"drilldown": {},
"tooltip": {
"enabled": true,
"useHTML": false,
"format": null,
"headerFormat": "",
"pointFormat": "<span style=\"color:{series.color}\">Single</span>: <b>{point.x:.0f}</b><br><span style=\"color:{series.color}\">Multi</span>: <b>{point.y:.0f}</b>",
"footerFormat": "",
"shared": false,
"outside": false,
"valueDecimals": null,
"split": false
},
"annotations": null
},
"hc_type": "chart",
"id": "139857858680972835925753439925120548129"
}
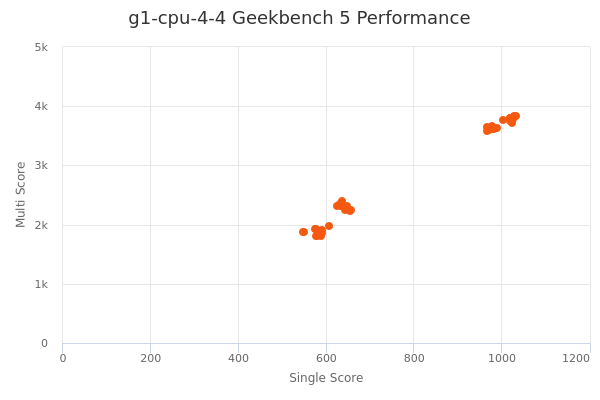
| Single | Multi | |
|---|---|---|
| Max | 1033 | 3842 |
| Average | 804 | 2898 |
| Deviation | 196.57 | 826.17 |
| Min | 549 | 1807 |
Sign up as Freemium to get more insight.
- In same series
- g1-cpu-2-2
- g1-cpu-4-4
- g1-cpu-8-8
- g1-cpu-16-16
- g1-cpu-32-32