g1-cpu-2-2 by G-Core
Geekbench is a cross-platform processor benchmark with a scoring system that determines single-core and multi-core performance using loads simulating real-world scenarios. Geekbench 5 score is calculated with a reference score of 2500 representing the performance of the Intel Core i5-2520M @ 2.50 GHz. The software benchmark is available for Mac OS, Windows, Linux, Android and iOS platforms.
Specifications:
CPU
2
RAM
2.0 GB
{
"configuration": {
"chart": {
"type": "scatter",
"polar": false,
"zoomType": "",
"options3d": {},
"height": null,
"width": null,
"margin": null,
"inverted": false,
"zooming": {}
},
"credits": {
"enabled": false
},
"title": {
"text": ""
},
"colorAxis": null,
"subtitle": {
"text": ""
},
"xAxis": {
"title": {
"text": [
"Single Score"
],
"useHTML": false,
"style": {
"color": "#666666"
}
},
"categories": null,
"lineWidth": 1,
"tickInterval": null,
"tickWidth": 1,
"tickLength": 10,
"tickPixelInterval": 100,
"plotLines": null,
"labels": {
"enabled": true,
"format": null,
"formatter": "",
"style": {
"color": "#666666",
"cursor": "default",
"fontSize": "11px"
},
"useHTML": false,
"step": 0
},
"plotBands": null,
"visible": true,
"floor": null,
"ceiling": null,
"type": "linear",
"min": 0,
"gridLineWidth": 1,
"gridLineColor": "#e6e6e6",
"minorTickInterval": null,
"minorTickWidth": 0,
"minTickInterval": null,
"startOnTick": true,
"endOnTick": true,
"tickmarkPlacement": 100,
"units": 100,
"minRange": 100
},
"yAxis": {
"title": {
"text": [
"Multi Score"
],
"useHTML": false,
"style": {
"color": "#666666"
}
},
"categories": null,
"plotLines": null,
"plotBands": null,
"lineWidth": null,
"tickInterval": null,
"tickLength": 10,
"floor": null,
"ceiling": null,
"gridLineInterpolation": null,
"gridLineWidth": 1,
"gridLineColor": "#e6e6e6",
"min": 0,
"max": null,
"minorTickInterval": null,
"minorTickWidth": 0,
"minTickInterval": null,
"startOnTick": true,
"endOnTick": true,
"minRange": null,
"type": "linear",
"tickmarkPlacement": null,
"labels": {
"enabled": true,
"formatter": null,
"style": {
"color": "#666666",
"cursor": "default",
"fontSize": "11px"
},
"useHTML": false
}
},
"zAxis": {
"title": {
"text": "Multi Score"
}
},
"plotOptions": {
"series": {
"dataLabels": {
"enabled": false,
"format": null,
"distance": 30,
"align": "center",
"inside": null,
"allowOverlap": false,
"style": {
"fontSize": "11px"
}
},
"showInLegend": null,
"turboThreshold": 0,
"stacking": "",
"groupPadding": 0.2,
"centerInCategory": false,
"findNearestPointBy": "x"
}
},
"navigator": {
"enabled": false
},
"scrollbar": {
"enabled": false
},
"rangeSelector": {
"enabled": false,
"inputEnabled": false
},
"legend": {
"enabled": null,
"maxHeight": null,
"align": "center",
"verticalAlign": "bottom",
"layout": "horizontal",
"width": null,
"margin": 12,
"reversed": false
},
"series": [
{
"name": "g1-cpu-2-2 by G-Core",
"color": "#F5580F",
"data": [
{
"x": 633.699038254567,
"y": 1193.1217164888035
},
{
"x": 575.2954245652409,
"y": 1087.142756326019
},
{
"x": 634.6461803055945,
"y": 1177.0868853907318
},
{
"x": 589.2800442513104,
"y": 1014.0962600224999
},
{
"x": 633.9029661695517,
"y": 1192.6271891125773
},
{
"x": 578.157723682019,
"y": 1055.017983847204
},
{
"x": 607.0893438523675,
"y": 1236.5029652005614
},
{
"x": 570.7985872850387,
"y": 1116.826180680026
},
{
"x": 646.265351706006,
"y": 1205.3372037041493
},
{
"x": 591.6884006594025,
"y": 1098.9995649313475
},
{
"x": 649.3923274874667,
"y": 1250.7648874954
},
{
"x": 593.0481306938229,
"y": 1070.639524771506
},
{
"x": 609.774747535919,
"y": 1216.6856256681517
},
{
"x": 590.3576758262252,
"y": 1066.9114137926351
},
{
"x": 633.9830525488323,
"y": 1209.0801397767755
},
{
"x": 583.8406576321663,
"y": 1134.0739016587695
},
{
"x": 616.0852951475131,
"y": 1194.1815902774465
},
{
"x": 585.5240480963512,
"y": 1077.85615621907
},
{
"x": 626.718427176497,
"y": 1212.1575977878683
},
{
"x": 583.8246712821913,
"y": 1049.232207246051
}
]
}
],
"drilldown": {},
"tooltip": {
"enabled": true,
"useHTML": false,
"format": null,
"headerFormat": "",
"pointFormat": "<span style=\"color:{series.color}\">Single</span>: <b>{point.x:.0f}</b><br><span style=\"color:{series.color}\">Multi</span>: <b>{point.y:.0f}</b>",
"footerFormat": "",
"shared": false,
"outside": false,
"valueDecimals": null,
"split": false
},
"annotations": null
},
"hc_type": "chart",
"id": "130429933692352822610019506518975180712"
}
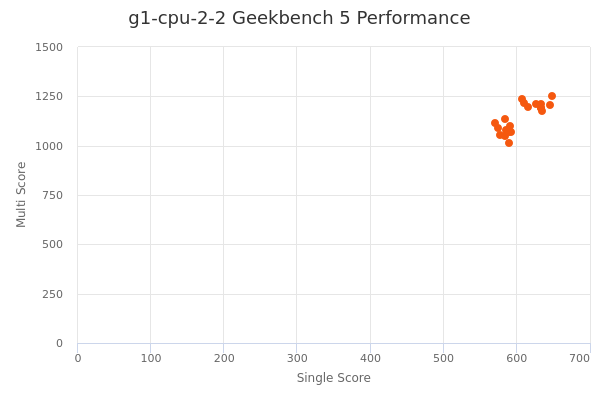
| Single | Multi | |
|---|---|---|
| Max | 649 | 1251 |
| Average | 607 | 1143 |
| Deviation | 24.95 | 71.35 |
| Min | 571 | 1014 |
Sign up as Freemium to get more insight.
- In same series
- g1-cpu-2-2
- g1-cpu-4-4
- g1-cpu-8-8
- g1-cpu-16-16
- g1-cpu-32-32