eo2.2xlarge by CloudFerro
Geekbench is a cross-platform processor benchmark with a scoring system that determines single-core and multi-core performance using loads simulating real-world scenarios. Geekbench 5 score is calculated with a reference score of 2500 representing the performance of the Intel Core i5-2520M @ 2.50 GHz. The software benchmark is available for Mac OS, Windows, Linux, Android and iOS platforms.
Specifications:
CPU
8
RAM
32.0 GB
Root
128 GB
eo2.2xlarge Root SSD
{
"configuration": {
"chart": {
"type": "scatter",
"polar": false,
"zoomType": "",
"options3d": {},
"height": null,
"width": null,
"margin": null,
"inverted": false,
"zooming": {}
},
"credits": {
"enabled": false
},
"title": {
"text": ""
},
"colorAxis": null,
"subtitle": {
"text": ""
},
"xAxis": {
"title": {
"text": [
"Single Score"
],
"useHTML": false,
"style": {
"color": "#666666"
}
},
"categories": null,
"lineWidth": 1,
"tickInterval": null,
"tickWidth": 1,
"tickLength": 10,
"tickPixelInterval": 100,
"plotLines": null,
"labels": {
"enabled": true,
"format": null,
"formatter": "",
"style": {
"color": "#666666",
"cursor": "default",
"fontSize": "11px"
},
"useHTML": false,
"step": 0
},
"plotBands": null,
"visible": true,
"floor": null,
"ceiling": null,
"type": "linear",
"min": 0,
"gridLineWidth": 1,
"gridLineColor": "#e6e6e6",
"minorTickInterval": null,
"minorTickWidth": 0,
"minTickInterval": null,
"startOnTick": true,
"endOnTick": true,
"tickmarkPlacement": 100,
"units": 100,
"minRange": 100
},
"yAxis": {
"title": {
"text": [
"Multi Score"
],
"useHTML": false,
"style": {
"color": "#666666"
}
},
"categories": null,
"plotLines": null,
"plotBands": null,
"lineWidth": null,
"tickInterval": null,
"tickLength": 10,
"floor": null,
"ceiling": null,
"gridLineInterpolation": null,
"gridLineWidth": 1,
"gridLineColor": "#e6e6e6",
"min": 0,
"max": null,
"minorTickInterval": null,
"minorTickWidth": 0,
"minTickInterval": null,
"startOnTick": true,
"endOnTick": true,
"minRange": null,
"type": "linear",
"tickmarkPlacement": null,
"labels": {
"enabled": true,
"formatter": null,
"style": {
"color": "#666666",
"cursor": "default",
"fontSize": "11px"
},
"useHTML": false
}
},
"zAxis": {
"title": {
"text": "Multi Score"
}
},
"plotOptions": {
"series": {
"dataLabels": {
"enabled": false,
"format": null,
"distance": 30,
"align": "center",
"inside": null,
"allowOverlap": false,
"style": {
"fontSize": "11px"
}
},
"showInLegend": null,
"turboThreshold": 0,
"stacking": "",
"groupPadding": 0.2,
"centerInCategory": false,
"findNearestPointBy": "x"
}
},
"navigator": {
"enabled": false
},
"scrollbar": {
"enabled": false
},
"rangeSelector": {
"enabled": false,
"inputEnabled": false
},
"legend": {
"enabled": null,
"maxHeight": null,
"align": "center",
"verticalAlign": "bottom",
"layout": "horizontal",
"width": null,
"margin": 12,
"reversed": false
},
"series": [
{
"name": "eo2.2xlarge by CloudFerro",
"color": "#FF8225",
"data": [
{
"x": 659.305587102183,
"y": 4557.094188772648
},
{
"x": 613.9181589279293,
"y": 3451.9621188149913
},
{
"x": 657.0140288421416,
"y": 4535.089920819435
},
{
"x": 602.5761560439502,
"y": 3273.068072916392
},
{
"x": 661.168337693433,
"y": 4458.849223934885
},
{
"x": 600.8458809557707,
"y": 3463.1958003218747
},
{
"x": 658.2497262550762,
"y": 4501.447302476073
},
{
"x": 601.9769306678412,
"y": 3385.1790099974264
},
{
"x": 666.553177351074,
"y": 4495.6982086808275
},
{
"x": 596.8884404964069,
"y": 3375.2364317416896
},
{
"x": 665.0847483769998,
"y": 4572.857313045646
},
{
"x": 600.4064012741367,
"y": 3482.313058485873
},
{
"x": 667.7635516713572,
"y": 4518.509911436671
},
{
"x": 675.338059490549,
"y": 4568.625552580308
},
{
"x": 604.1816070001059,
"y": 3412.310929442349
},
{
"x": 680.9230891497269,
"y": 4516.580592181753
},
{
"x": 610.8361148295877,
"y": 3293.3432532233965
},
{
"x": 661.3540256284625,
"y": 4548.257733136138
},
{
"x": 589.2805443158857,
"y": 3310.077916383938
},
{
"x": 611.2373177143771,
"y": 3281.2466452474537
}
]
}
],
"drilldown": {},
"tooltip": {
"enabled": true,
"useHTML": false,
"format": null,
"headerFormat": "",
"pointFormat": "<span style=\"color:{series.color}\">Single</span>: <b>{point.x:.0f}</b><br><span style=\"color:{series.color}\">Multi</span>: <b>{point.y:.0f}</b>",
"footerFormat": "",
"shared": false,
"outside": false,
"valueDecimals": null,
"split": false
},
"annotations": null
},
"hc_type": "chart",
"id": "220318171228928286117201827017673105708"
}
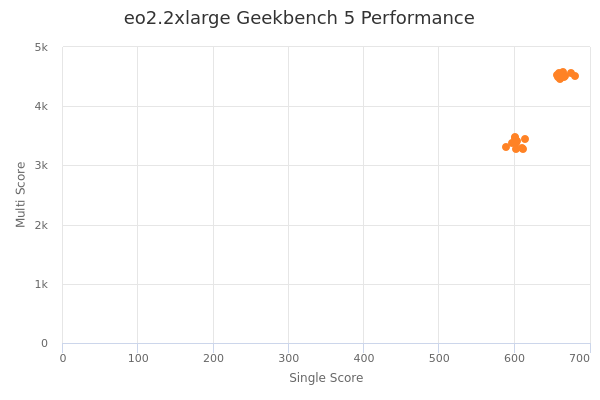
| Single | Multi | |
|---|---|---|
| Max | 681 | 4573 |
| Average | 634 | 3950 |
| Deviation | 31.85 | 580.21 |
| Min | 589 | 3273 |
Sign up as Freemium to get more insight.
- In same series
- eo2.medium
- eo2.large
- eo2.xlarge
- eo2.2xlarge
- eo2.3xlarge
- eo2.4xlarge