Standard_DS3_v2 by Microsoft Azure
Geekbench is a cross-platform processor benchmark with a scoring system that determines single-core and multi-core performance using loads simulating real-world scenarios. Geekbench 5 score is calculated with a reference score of 2500 representing the performance of the Intel Core i5-2520M @ 2.50 GHz. The software benchmark is available for Mac OS, Windows, Linux, Android and iOS platforms.
Specifications:
CPU
4
RAM
14.0 GB
Extra
1x
28 GB
N/A
{
"configuration": {
"chart": {
"type": "scatter",
"polar": false,
"zoomType": "",
"options3d": {},
"height": null,
"width": null,
"margin": null,
"inverted": false,
"zooming": {}
},
"credits": {
"enabled": false
},
"title": {
"text": ""
},
"colorAxis": null,
"subtitle": {
"text": ""
},
"xAxis": {
"title": {
"text": [
"Single Score"
],
"useHTML": false,
"style": {
"color": "#666666"
}
},
"categories": null,
"lineWidth": 1,
"tickInterval": null,
"tickWidth": 1,
"tickLength": 10,
"tickPixelInterval": 100,
"plotLines": null,
"labels": {
"enabled": true,
"format": null,
"formatter": "",
"style": {
"color": "#666666",
"cursor": "default",
"fontSize": "11px"
},
"useHTML": false,
"step": 0
},
"plotBands": null,
"visible": true,
"floor": null,
"ceiling": null,
"type": "linear",
"min": 0,
"gridLineWidth": 1,
"gridLineColor": "#e6e6e6",
"minorTickInterval": null,
"minorTickWidth": 0,
"minTickInterval": null,
"startOnTick": true,
"endOnTick": true,
"tickmarkPlacement": 100,
"units": 100,
"minRange": 100
},
"yAxis": {
"title": {
"text": [
"Multi Score"
],
"useHTML": false,
"style": {
"color": "#666666"
}
},
"categories": null,
"plotLines": null,
"plotBands": null,
"lineWidth": null,
"tickInterval": null,
"tickLength": 10,
"floor": null,
"ceiling": null,
"gridLineInterpolation": null,
"gridLineWidth": 1,
"gridLineColor": "#e6e6e6",
"min": 0,
"max": null,
"minorTickInterval": null,
"minorTickWidth": 0,
"minTickInterval": null,
"startOnTick": true,
"endOnTick": true,
"minRange": null,
"type": "linear",
"tickmarkPlacement": null,
"labels": {
"enabled": true,
"formatter": null,
"style": {
"color": "#666666",
"cursor": "default",
"fontSize": "11px"
},
"useHTML": false
}
},
"zAxis": {
"title": {
"text": "Multi Score"
}
},
"plotOptions": {
"series": {
"dataLabels": {
"enabled": false,
"format": null,
"distance": 30,
"align": "center",
"inside": null,
"allowOverlap": false,
"style": {
"fontSize": "11px"
}
},
"showInLegend": null,
"turboThreshold": 0,
"stacking": "",
"groupPadding": 0.2,
"centerInCategory": false,
"findNearestPointBy": "x"
}
},
"navigator": {
"enabled": false
},
"scrollbar": {
"enabled": false
},
"rangeSelector": {
"enabled": false,
"inputEnabled": false
},
"legend": {
"enabled": null,
"maxHeight": null,
"align": "center",
"verticalAlign": "bottom",
"layout": "horizontal",
"width": null,
"margin": 12,
"reversed": false
},
"series": [
{
"name": "Standard_DS3_v2 by Microsoft Azure",
"color": "#55b3ff",
"data": [
{
"x": 750.2820414455251,
"y": 2814.0115342146673
},
{
"x": 691.8003122157395,
"y": 2712.649420457799
},
{
"x": 746.7771907362926,
"y": 2783.4008130358616
},
{
"x": 702.8535642865279,
"y": 2695.8821772139136
},
{
"x": 749.3210547277657,
"y": 2797.5157648434497
},
{
"x": 715.8691875662146,
"y": 2701.7876603940485
},
{
"x": 747.0978240082902,
"y": 2781.1989400208477
},
{
"x": 708.2742938553862,
"y": 2697.040937045886
},
{
"x": 747.5640965244446,
"y": 2783.608808202691
},
{
"x": 712.5756530842618,
"y": 2707.9664062576053
},
{
"x": 749.1399918576826,
"y": 2768.664979464755
},
{
"x": 716.871134814672,
"y": 2726.309079705091
},
{
"x": 750.9697031932519,
"y": 2842.325910942646
},
{
"x": 716.3383623500295,
"y": 2699.0140599902784
},
{
"x": 751.8777219921503,
"y": 2799.8655748621522
},
{
"x": 713.2418091392499,
"y": 2714.770436372455
},
{
"x": 732.6624702670481,
"y": 2819.708260858407
},
{
"x": 696.1732412444619,
"y": 2716.316679506303
},
{
"x": 728.3291256201545,
"y": 2800.100631787559
},
{
"x": 701.8579023435544,
"y": 2707.224083341037
}
]
}
],
"drilldown": {},
"tooltip": {
"enabled": true,
"useHTML": false,
"format": null,
"headerFormat": "",
"pointFormat": "<span style=\"color:{series.color}\">Single</span>: <b>{point.x:.0f}</b><br><span style=\"color:{series.color}\">Multi</span>: <b>{point.y:.0f}</b>",
"footerFormat": "",
"shared": false,
"outside": false,
"valueDecimals": null,
"split": false
},
"annotations": null
},
"hc_type": "chart",
"id": "190467188770066066566211603015519243832"
}
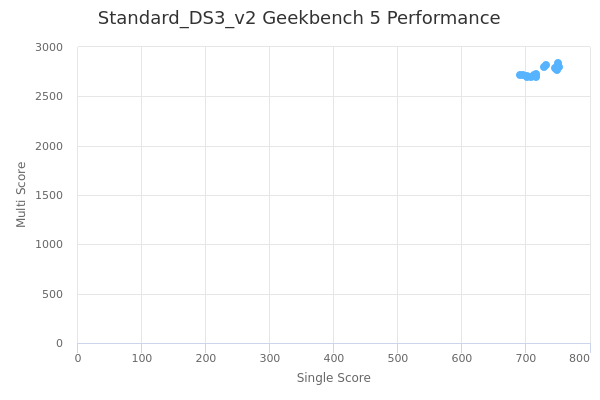
| Single | Multi | |
|---|---|---|
| Max | 752 | 2842 |
| Average | 726 | 2753 |
| Deviation | 20.57 | 48.29 |
| Min | 692 | 2696 |
Sign up as Freemium to get more insight.