Standard_D8_v3 by Microsoft Azure
Geekbench is a cross-platform processor benchmark with a scoring system that determines single-core and multi-core performance using loads simulating real-world scenarios. Geekbench 5 score is calculated with a reference score of 2500 representing the performance of the Intel Core i5-2520M @ 2.50 GHz. The software benchmark is available for Mac OS, Windows, Linux, Android and iOS platforms.
Specifications:
CPU
8
RAM
32.0 GB
Extra
1x
200 GB
N/A
{
"configuration": {
"chart": {
"type": "scatter",
"polar": false,
"zoomType": "",
"options3d": {},
"height": null,
"width": null,
"margin": null,
"inverted": false,
"zooming": {}
},
"credits": {
"enabled": false
},
"title": {
"text": ""
},
"colorAxis": null,
"subtitle": {
"text": ""
},
"xAxis": {
"title": {
"text": [
"Single Score"
],
"useHTML": false,
"style": {
"color": "#666666"
}
},
"categories": null,
"lineWidth": 1,
"tickInterval": null,
"tickWidth": 1,
"tickLength": 10,
"tickPixelInterval": 100,
"plotLines": null,
"labels": {
"enabled": true,
"format": null,
"formatter": "",
"style": {
"color": "#666666",
"cursor": "default",
"fontSize": "11px"
},
"useHTML": false,
"step": 0
},
"plotBands": null,
"visible": true,
"floor": null,
"ceiling": null,
"type": "linear",
"min": 0,
"gridLineWidth": 1,
"gridLineColor": "#e6e6e6",
"minorTickInterval": null,
"minorTickWidth": 0,
"minTickInterval": null,
"startOnTick": true,
"endOnTick": true,
"tickmarkPlacement": 100,
"units": 100,
"minRange": 100
},
"yAxis": {
"title": {
"text": [
"Multi Score"
],
"useHTML": false,
"style": {
"color": "#666666"
}
},
"categories": null,
"plotLines": null,
"plotBands": null,
"lineWidth": null,
"tickInterval": null,
"tickLength": 10,
"floor": null,
"ceiling": null,
"gridLineInterpolation": null,
"gridLineWidth": 1,
"gridLineColor": "#e6e6e6",
"min": 0,
"max": null,
"minorTickInterval": null,
"minorTickWidth": 0,
"minTickInterval": null,
"startOnTick": true,
"endOnTick": true,
"minRange": null,
"type": "linear",
"tickmarkPlacement": null,
"labels": {
"enabled": true,
"formatter": null,
"style": {
"color": "#666666",
"cursor": "default",
"fontSize": "11px"
},
"useHTML": false
}
},
"zAxis": {
"title": {
"text": "Multi Score"
}
},
"plotOptions": {
"series": {
"dataLabels": {
"enabled": false,
"format": null,
"distance": 30,
"align": "center",
"inside": null,
"allowOverlap": false,
"style": {
"fontSize": "11px"
}
},
"showInLegend": null,
"turboThreshold": 0,
"stacking": "",
"groupPadding": 0.2,
"centerInCategory": false,
"findNearestPointBy": "x"
}
},
"navigator": {
"enabled": false
},
"scrollbar": {
"enabled": false
},
"rangeSelector": {
"enabled": false,
"inputEnabled": false
},
"legend": {
"enabled": null,
"maxHeight": null,
"align": "center",
"verticalAlign": "bottom",
"layout": "horizontal",
"width": null,
"margin": 12,
"reversed": false
},
"series": [
{
"name": "Standard_D8_v3 by Microsoft Azure",
"color": "#55b3ff",
"data": [
{
"x": 685.11518820271,
"y": 3102.947537402748
},
{
"x": 662.5101617681174,
"y": 3032.943908529753
},
{
"x": 672.75354961947,
"y": 3084.750435674939
},
{
"x": 654.8909921265096,
"y": 3032.792880586217
},
{
"x": 677.0949170564111,
"y": 3104.8353832079974
},
{
"x": 677.0474128857604,
"y": 3022.710408922674
},
{
"x": 689.2975124023654,
"y": 3080.427271194495
},
{
"x": 687.8499567149925,
"y": 3036.8318399327304
},
{
"x": 680.0627298924906,
"y": 3113.079749947611
},
{
"x": 668.0214256270265,
"y": 3048.777886475107
},
{
"x": 680.3416068667586,
"y": 3114.5437136279866
},
{
"x": 680.112467605274,
"y": 3017.5615046477615
},
{
"x": 687.356892781296,
"y": 3073.079527399759
},
{
"x": 671.4251286498368,
"y": 3039.086686265792
},
{
"x": 689.5184446755251,
"y": 3090.165327269573
},
{
"x": 672.681948372285,
"y": 3024.462415414134
},
{
"x": 673.2850673409064,
"y": 3110.8633364322036
},
{
"x": 673.687488593326,
"y": 3020.1940565962473
},
{
"x": 687.5922831619929,
"y": 3103.5070567391667
},
{
"x": 691.4649840472593,
"y": 3018.881556077621
}
]
}
],
"drilldown": {},
"tooltip": {
"enabled": true,
"useHTML": false,
"format": null,
"headerFormat": "",
"pointFormat": "<span style=\"color:{series.color}\">Single</span>: <b>{point.x:.0f}</b><br><span style=\"color:{series.color}\">Multi</span>: <b>{point.y:.0f}</b>",
"footerFormat": "",
"shared": false,
"outside": false,
"valueDecimals": null,
"split": false
},
"annotations": null
},
"hc_type": "chart",
"id": "301606900996366440125813890513237067096"
}
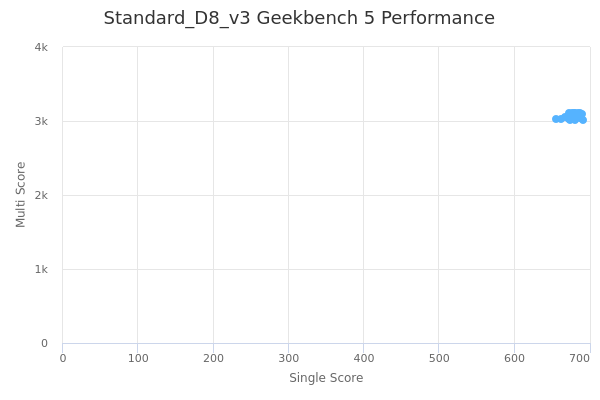
| Single | Multi | |
|---|---|---|
| Max | 691 | 3115 |
| Average | 678 | 3064 |
| Deviation | 9.48 | 36.25 |
| Min | 655 | 3018 |
Sign up as Freemium to get more insight.