Standard_D4_v3 by Microsoft Azure
Geekbench is a cross-platform processor benchmark with a scoring system that determines single-core and multi-core performance using loads simulating real-world scenarios. Geekbench 5 score is calculated with a reference score of 2500 representing the performance of the Intel Core i5-2520M @ 2.50 GHz. The software benchmark is available for Mac OS, Windows, Linux, Android and iOS platforms.
Specifications:
CPU
4
RAM
16.0 GB
Extra
1x
100 GB
N/A
{
"configuration": {
"chart": {
"type": "scatter",
"polar": false,
"zoomType": "",
"options3d": {},
"height": null,
"width": null,
"margin": null,
"inverted": false,
"zooming": {}
},
"credits": {
"enabled": false
},
"title": {
"text": ""
},
"colorAxis": null,
"subtitle": {
"text": ""
},
"xAxis": {
"title": {
"text": [
"Single Score"
],
"useHTML": false,
"style": {
"color": "#666666"
}
},
"categories": null,
"lineWidth": 1,
"tickInterval": null,
"tickWidth": 1,
"tickLength": 10,
"tickPixelInterval": 100,
"plotLines": null,
"labels": {
"enabled": true,
"format": null,
"formatter": "",
"style": {
"color": "#666666",
"cursor": "default",
"fontSize": "11px"
},
"useHTML": false,
"step": 0
},
"plotBands": null,
"visible": true,
"floor": null,
"ceiling": null,
"type": "linear",
"min": 0,
"gridLineWidth": 1,
"gridLineColor": "#e6e6e6",
"minorTickInterval": null,
"minorTickWidth": 0,
"minTickInterval": null,
"startOnTick": true,
"endOnTick": true,
"tickmarkPlacement": 100,
"units": 100,
"minRange": 100
},
"yAxis": {
"title": {
"text": [
"Multi Score"
],
"useHTML": false,
"style": {
"color": "#666666"
}
},
"categories": null,
"plotLines": null,
"plotBands": null,
"lineWidth": null,
"tickInterval": null,
"tickLength": 10,
"floor": null,
"ceiling": null,
"gridLineInterpolation": null,
"gridLineWidth": 1,
"gridLineColor": "#e6e6e6",
"min": 0,
"max": null,
"minorTickInterval": null,
"minorTickWidth": 0,
"minTickInterval": null,
"startOnTick": true,
"endOnTick": true,
"minRange": null,
"type": "linear",
"tickmarkPlacement": null,
"labels": {
"enabled": true,
"formatter": null,
"style": {
"color": "#666666",
"cursor": "default",
"fontSize": "11px"
},
"useHTML": false
}
},
"zAxis": {
"title": {
"text": "Multi Score"
}
},
"plotOptions": {
"series": {
"dataLabels": {
"enabled": false,
"format": null,
"distance": 30,
"align": "center",
"inside": null,
"allowOverlap": false,
"style": {
"fontSize": "11px"
}
},
"showInLegend": null,
"turboThreshold": 0,
"stacking": "",
"groupPadding": 0.2,
"centerInCategory": false,
"findNearestPointBy": "x"
}
},
"navigator": {
"enabled": false
},
"scrollbar": {
"enabled": false
},
"rangeSelector": {
"enabled": false,
"inputEnabled": false
},
"legend": {
"enabled": null,
"maxHeight": null,
"align": "center",
"verticalAlign": "bottom",
"layout": "horizontal",
"width": null,
"margin": 12,
"reversed": false
},
"series": [
{
"name": "Standard_D4_v3 by Microsoft Azure",
"color": "#55b3ff",
"data": [
{
"x": 710.8764449617921,
"y": 1649.8512708066492
},
{
"x": 697.3854295792602,
"y": 1623.3890820963095
},
{
"x": 711.5122979957636,
"y": 1662.9330371980716
},
{
"x": 685.8410505845037,
"y": 1619.8102148984406
},
{
"x": 681.4879036993494,
"y": 1633.8100009219756
},
{
"x": 688.257999914042,
"y": 1617.6118508892966
},
{
"x": 692.9563315254449,
"y": 1654.1802317219276
},
{
"x": 685.0449676130874,
"y": 1620.401270699732
},
{
"x": 702.9266504879358,
"y": 1653.9605685906931
},
{
"x": 692.3762052612446,
"y": 1615.4524376721608
},
{
"x": 733.6038680309134,
"y": 1687.951285805898
},
{
"x": 670.661880698663,
"y": 1566.5744851931058
},
{
"x": 714.9704254637013,
"y": 1670.333746631074
},
{
"x": 681.6957500067323,
"y": 1492.1810201577014
},
{
"x": 710.8772181049804,
"y": 1676.7730861008881
},
{
"x": 690.9351543327901,
"y": 1582.1153749802115
},
{
"x": 730.0440868356418,
"y": 1708.8263651446352
},
{
"x": 686.9261720603977,
"y": 1585.6802664639436
},
{
"x": 730.40771702364,
"y": 1692.8289324004793
},
{
"x": 678.4626138923204,
"y": 1586.442696564282
},
{
"x": 721.780242763828,
"y": 1678.0804558554164
},
{
"x": 683.0753762580979,
"y": 1582.7322985310016
},
{
"x": 712.0677215161818,
"y": 1671.8356122853727
},
{
"x": 662.3066160003816,
"y": 1561.812988728498
},
{
"x": 708.742758185122,
"y": 1711.2340606744451
},
{
"x": 697.7992307286182,
"y": 1580.6329950822865
},
{
"x": 730.2542566112351,
"y": 1715.469584433828
},
{
"x": 704.6824093420994,
"y": 1577.2134669528746
},
{
"x": 713.8814058000135,
"y": 1672.7021785976244
},
{
"x": 704.8320264741006,
"y": 1573.4041451751557
},
{
"x": 812.2710969162172,
"y": 1941.6790692925615
},
{
"x": 596.3991418533202,
"y": 1412.2644061625083
},
{
"x": 818.4202877504868,
"y": 1920.0686857455325
},
{
"x": 600.4230423170739,
"y": 1397.6802440428953
},
{
"x": 828.5852606446113,
"y": 1954.3282843582842
},
{
"x": 616.989494446324,
"y": 1424.0135430898395
}
]
}
],
"drilldown": {},
"tooltip": {
"enabled": true,
"useHTML": false,
"format": null,
"headerFormat": "",
"pointFormat": "<span style=\"color:{series.color}\">Single</span>: <b>{point.x:.0f}</b><br><span style=\"color:{series.color}\">Multi</span>: <b>{point.y:.0f}</b>",
"footerFormat": "",
"shared": false,
"outside": false,
"valueDecimals": null,
"split": false
},
"annotations": null
},
"hc_type": "chart",
"id": "77698418140605627977324601016677319019"
}
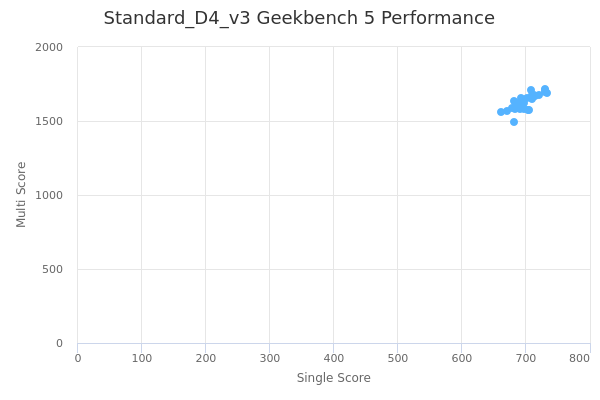
| Single | Multi | |
|---|---|---|
| Max | 829 | 1954 |
| Average | 702 | 1638 |
| Deviation | 47.30 | 119.34 |
| Min | 596 | 1398 |
Sign up as Freemium to get more insight.