Standard_D4as_v4 by Microsoft Azure
Geekbench is a cross-platform processor benchmark with a scoring system that determines single-core and multi-core performance using loads simulating real-world scenarios. Geekbench 5 score is calculated with a reference score of 2500 representing the performance of the Intel Core i5-2520M @ 2.50 GHz. The software benchmark is available for Mac OS, Windows, Linux, Android and iOS platforms.
Specifications:
CPU
4
RAM
16.0 GB
Extra
1x
32 GB
N/A
{
"configuration": {
"chart": {
"type": "scatter",
"polar": false,
"zoomType": "",
"options3d": {},
"height": null,
"width": null,
"margin": null,
"inverted": false,
"zooming": {}
},
"credits": {
"enabled": false
},
"title": {
"text": ""
},
"colorAxis": null,
"subtitle": {
"text": ""
},
"xAxis": {
"title": {
"text": [
"Single Score"
],
"useHTML": false,
"style": {
"color": "#666666"
}
},
"categories": null,
"lineWidth": 1,
"tickInterval": null,
"tickWidth": 1,
"tickLength": 10,
"tickPixelInterval": 100,
"plotLines": null,
"labels": {
"enabled": true,
"format": null,
"formatter": "",
"style": {
"color": "#666666",
"cursor": "default",
"fontSize": "11px"
},
"useHTML": false,
"step": 0
},
"plotBands": null,
"visible": true,
"floor": null,
"ceiling": null,
"type": "linear",
"min": 0,
"gridLineWidth": 1,
"gridLineColor": "#e6e6e6",
"minorTickInterval": null,
"minorTickWidth": 0,
"minTickInterval": null,
"startOnTick": true,
"endOnTick": true,
"tickmarkPlacement": 100,
"units": 100,
"minRange": 100
},
"yAxis": {
"title": {
"text": [
"Multi Score"
],
"useHTML": false,
"style": {
"color": "#666666"
}
},
"categories": null,
"plotLines": null,
"plotBands": null,
"lineWidth": null,
"tickInterval": null,
"tickLength": 10,
"floor": null,
"ceiling": null,
"gridLineInterpolation": null,
"gridLineWidth": 1,
"gridLineColor": "#e6e6e6",
"min": 0,
"max": null,
"minorTickInterval": null,
"minorTickWidth": 0,
"minTickInterval": null,
"startOnTick": true,
"endOnTick": true,
"minRange": null,
"type": "linear",
"tickmarkPlacement": null,
"labels": {
"enabled": true,
"formatter": null,
"style": {
"color": "#666666",
"cursor": "default",
"fontSize": "11px"
},
"useHTML": false
}
},
"zAxis": {
"title": {
"text": "Multi Score"
}
},
"plotOptions": {
"series": {
"dataLabels": {
"enabled": false,
"format": null,
"distance": 30,
"align": "center",
"inside": null,
"allowOverlap": false,
"style": {
"fontSize": "11px"
}
},
"showInLegend": null,
"turboThreshold": 0,
"stacking": "",
"groupPadding": 0.2,
"centerInCategory": false,
"findNearestPointBy": "x"
}
},
"navigator": {
"enabled": false
},
"scrollbar": {
"enabled": false
},
"rangeSelector": {
"enabled": false,
"inputEnabled": false
},
"legend": {
"enabled": null,
"maxHeight": null,
"align": "center",
"verticalAlign": "bottom",
"layout": "horizontal",
"width": null,
"margin": 12,
"reversed": false
},
"series": [
{
"name": "Standard_D4as_v4 by Microsoft Azure",
"color": "#55b3ff",
"data": [
{
"x": 1058.862775667152,
"y": 2555.6378089109903
},
{
"x": 1051.161773469894,
"y": 2562.7125495111677
},
{
"x": 1061.11674119009,
"y": 2549.5261462115463
},
{
"x": 1065.8560380337126,
"y": 2556.51259223825
},
{
"x": 1061.2774076559708,
"y": 2553.1738534787164
},
{
"x": 1066.8439419983022,
"y": 2559.668939589411
},
{
"x": 1062.1038933538446,
"y": 2561.010128088335
},
{
"x": 1063.410982207134,
"y": 2531.1143095308544
},
{
"x": 1061.525716633896,
"y": 2548.547096771981
},
{
"x": 1004.9855181085088,
"y": 2489.203844747977
},
{
"x": 1061.8042955774613,
"y": 2544.6330192822384
},
{
"x": 1036.7859690078337,
"y": 2528.894548601173
},
{
"x": 1058.1011418367743,
"y": 2550.4337049472
},
{
"x": 1019.0147255698704,
"y": 2541.3436090776995
},
{
"x": 1062.9770239310046,
"y": 2555.714778865554
},
{
"x": 1057.227209151517,
"y": 2544.020189092598
},
{
"x": 1061.6464141405984,
"y": 2556.251428872529
},
{
"x": 1051.9392808608054,
"y": 2549.8308893106932
},
{
"x": 1060.9103682763487,
"y": 2549.4599751131445
},
{
"x": 1055.4107050053535,
"y": 2499.176548622723
}
]
}
],
"drilldown": {},
"tooltip": {
"enabled": true,
"useHTML": false,
"format": null,
"headerFormat": "",
"pointFormat": "<span style=\"color:{series.color}\">Single</span>: <b>{point.x:.0f}</b><br><span style=\"color:{series.color}\">Multi</span>: <b>{point.y:.0f}</b>",
"footerFormat": "",
"shared": false,
"outside": false,
"valueDecimals": null,
"split": false
},
"annotations": null
},
"hc_type": "chart",
"id": "333438890453502091532671802265801350134"
}
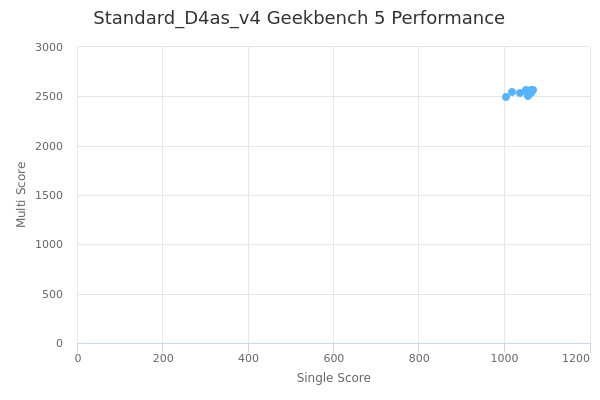
| Single | Multi | |
|---|---|---|
| Max | 1067 | 2563 |
| Average | 1054 | 2544 |
| Deviation | 15.58 | 18.86 |
| Min | 1005 | 2489 |
Sign up as Freemium to get more insight.