Standard_D2as_v4 by Microsoft Azure
Geekbench is a cross-platform processor benchmark with a scoring system that determines single-core and multi-core performance using loads simulating real-world scenarios. Geekbench 5 score is calculated with a reference score of 2500 representing the performance of the Intel Core i5-2520M @ 2.50 GHz. The software benchmark is available for Mac OS, Windows, Linux, Android and iOS platforms.
Specifications:
CPU
2
RAM
8.0 GB
Extra
1x
16 GB
N/A
{
"configuration": {
"chart": {
"type": "scatter",
"polar": false,
"zoomType": "",
"options3d": {},
"height": null,
"width": null,
"margin": null,
"inverted": false,
"zooming": {}
},
"credits": {
"enabled": false
},
"title": {
"text": ""
},
"colorAxis": null,
"subtitle": {
"text": ""
},
"xAxis": {
"title": {
"text": [
"Single Score"
],
"useHTML": false,
"style": {
"color": "#666666"
}
},
"categories": null,
"lineWidth": 1,
"tickInterval": null,
"tickWidth": 1,
"tickLength": 10,
"tickPixelInterval": 100,
"plotLines": null,
"labels": {
"enabled": true,
"format": null,
"formatter": "",
"style": {
"color": "#666666",
"cursor": "default",
"fontSize": "11px"
},
"useHTML": false,
"step": 0
},
"plotBands": null,
"visible": true,
"floor": null,
"ceiling": null,
"type": "linear",
"min": 0,
"gridLineWidth": 1,
"gridLineColor": "#e6e6e6",
"minorTickInterval": null,
"minorTickWidth": 0,
"minTickInterval": null,
"startOnTick": true,
"endOnTick": true,
"tickmarkPlacement": 100,
"units": 100,
"minRange": 100
},
"yAxis": {
"title": {
"text": [
"Multi Score"
],
"useHTML": false,
"style": {
"color": "#666666"
}
},
"categories": null,
"plotLines": null,
"plotBands": null,
"lineWidth": null,
"tickInterval": null,
"tickLength": 10,
"floor": null,
"ceiling": null,
"gridLineInterpolation": null,
"gridLineWidth": 1,
"gridLineColor": "#e6e6e6",
"min": 0,
"max": null,
"minorTickInterval": null,
"minorTickWidth": 0,
"minTickInterval": null,
"startOnTick": true,
"endOnTick": true,
"minRange": null,
"type": "linear",
"tickmarkPlacement": null,
"labels": {
"enabled": true,
"formatter": null,
"style": {
"color": "#666666",
"cursor": "default",
"fontSize": "11px"
},
"useHTML": false
}
},
"zAxis": {
"title": {
"text": "Multi Score"
}
},
"plotOptions": {
"series": {
"dataLabels": {
"enabled": false,
"format": null,
"distance": 30,
"align": "center",
"inside": null,
"allowOverlap": false,
"style": {
"fontSize": "11px"
}
},
"showInLegend": null,
"turboThreshold": 0,
"stacking": "",
"groupPadding": 0.2,
"centerInCategory": false,
"findNearestPointBy": "x"
}
},
"navigator": {
"enabled": false
},
"scrollbar": {
"enabled": false
},
"rangeSelector": {
"enabled": false,
"inputEnabled": false
},
"legend": {
"enabled": null,
"maxHeight": null,
"align": "center",
"verticalAlign": "bottom",
"layout": "horizontal",
"width": null,
"margin": 12,
"reversed": false
},
"series": [
{
"name": "Standard_D2as_v4 by Microsoft Azure",
"color": "#55b3ff",
"data": [
{
"x": 1043.67299292519,
"y": 1332.0563205672172
},
{
"x": 922.7347065565614,
"y": 1202.1456145860557
},
{
"x": 1045.6830497358944,
"y": 1330.826967707329
},
{
"x": 932.4450446824555,
"y": 1183.2611474577857
},
{
"x": 1035.8046659123042,
"y": 1328.7300502175406
},
{
"x": 885.5230901570985,
"y": 1153.7668378324797
},
{
"x": 1029.6196999975116,
"y": 1329.9618542421388
},
{
"x": 902.6268073446379,
"y": 1181.944879805736
},
{
"x": 1042.7032250905522,
"y": 1332.7706427803737
},
{
"x": 903.2218843548151,
"y": 1172.706817355478
},
{
"x": 1047.5370398143084,
"y": 1327.305985193071
},
{
"x": 897.9644585364092,
"y": 1178.4505036082703
},
{
"x": 1044.0481048615763,
"y": 1332.1332387713799
},
{
"x": 900.6090001009832,
"y": 1181.075749015476
},
{
"x": 1037.26262404228,
"y": 1333.6021607934877
},
{
"x": 936.0166499111326,
"y": 1194.7706820289404
},
{
"x": 1033.0242673647956,
"y": 1330.7229116291333
},
{
"x": 963.3146739158889,
"y": 1226.5977711271669
},
{
"x": 1043.5145878375804,
"y": 1336.705841487711
},
{
"x": 931.6005776864363,
"y": 1199.2021771951797
}
]
}
],
"drilldown": {},
"tooltip": {
"enabled": true,
"useHTML": false,
"format": null,
"headerFormat": "",
"pointFormat": "<span style=\"color:{series.color}\">Single</span>: <b>{point.x:.0f}</b><br><span style=\"color:{series.color}\">Multi</span>: <b>{point.y:.0f}</b>",
"footerFormat": "",
"shared": false,
"outside": false,
"valueDecimals": null,
"split": false
},
"annotations": null
},
"hc_type": "chart",
"id": "7068984916840325441356763261319144566"
}
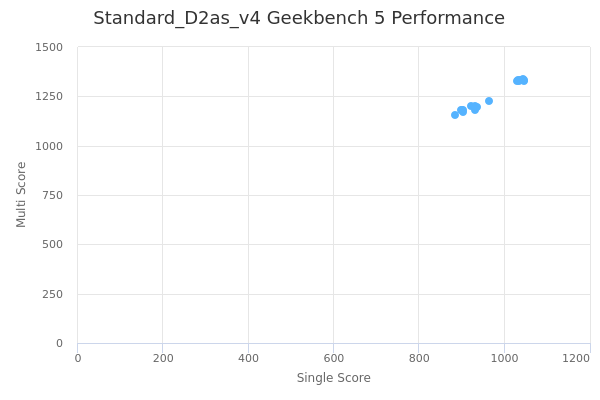
| Single | Multi | |
|---|---|---|
| Max | 1048 | 1337 |
| Average | 979 | 1259 |
| Deviation | 63.47 | 73.26 |
| Min | 886 | 1154 |
Sign up as Freemium to get more insight.