Standard_D2 by Microsoft Azure
Geekbench is a cross-platform processor benchmark with a scoring system that determines single-core and multi-core performance using loads simulating real-world scenarios. Geekbench 5 score is calculated with a reference score of 2500 representing the performance of the Intel Core i5-2520M @ 2.50 GHz. The software benchmark is available for Mac OS, Windows, Linux, Android and iOS platforms.
Specifications:
CPU
2
RAM
7.0 GB
Extra
1x
100 GB
N/A
{
"configuration": {
"chart": {
"type": "scatter",
"polar": false,
"zoomType": "",
"options3d": {},
"height": null,
"width": null,
"margin": null,
"inverted": false,
"zooming": {}
},
"credits": {
"enabled": false
},
"title": {
"text": ""
},
"colorAxis": null,
"subtitle": {
"text": ""
},
"xAxis": {
"title": {
"text": [
"Single Score"
],
"useHTML": false,
"style": {
"color": "#666666"
}
},
"categories": null,
"lineWidth": 1,
"tickInterval": null,
"tickWidth": 1,
"tickLength": 10,
"tickPixelInterval": 100,
"plotLines": null,
"labels": {
"enabled": true,
"format": null,
"formatter": "",
"style": {
"color": "#666666",
"cursor": "default",
"fontSize": "11px"
},
"useHTML": false,
"step": 0
},
"plotBands": null,
"visible": true,
"floor": null,
"ceiling": null,
"type": "linear",
"min": 0,
"gridLineWidth": 1,
"gridLineColor": "#e6e6e6",
"minorTickInterval": null,
"minorTickWidth": 0,
"minTickInterval": null,
"startOnTick": true,
"endOnTick": true,
"tickmarkPlacement": 100,
"units": 100,
"minRange": 100
},
"yAxis": {
"title": {
"text": [
"Multi Score"
],
"useHTML": false,
"style": {
"color": "#666666"
}
},
"categories": null,
"plotLines": null,
"plotBands": null,
"lineWidth": null,
"tickInterval": null,
"tickLength": 10,
"floor": null,
"ceiling": null,
"gridLineInterpolation": null,
"gridLineWidth": 1,
"gridLineColor": "#e6e6e6",
"min": 0,
"max": null,
"minorTickInterval": null,
"minorTickWidth": 0,
"minTickInterval": null,
"startOnTick": true,
"endOnTick": true,
"minRange": null,
"type": "linear",
"tickmarkPlacement": null,
"labels": {
"enabled": true,
"formatter": null,
"style": {
"color": "#666666",
"cursor": "default",
"fontSize": "11px"
},
"useHTML": false
}
},
"zAxis": {
"title": {
"text": "Multi Score"
}
},
"plotOptions": {
"series": {
"dataLabels": {
"enabled": false,
"format": null,
"distance": 30,
"align": "center",
"inside": null,
"allowOverlap": false,
"style": {
"fontSize": "11px"
}
},
"showInLegend": null,
"turboThreshold": 0,
"stacking": "",
"groupPadding": 0.2,
"centerInCategory": false,
"findNearestPointBy": "x"
}
},
"navigator": {
"enabled": false
},
"scrollbar": {
"enabled": false
},
"rangeSelector": {
"enabled": false,
"inputEnabled": false
},
"legend": {
"enabled": null,
"maxHeight": null,
"align": "center",
"verticalAlign": "bottom",
"layout": "horizontal",
"width": null,
"margin": 12,
"reversed": false
},
"series": [
{
"name": "Standard_D2 by Microsoft Azure",
"color": "#55b3ff",
"data": [
{
"x": 757.1655035408829,
"y": 1481.069984525162
},
{
"x": 458.9300644268523,
"y": 912.8723370687942
},
{
"x": 770.5295807315854,
"y": 1485.6779951854173
},
{
"x": 465.74210639470925,
"y": 931.8929836137772
},
{
"x": 764.7802889197584,
"y": 1495.9175730378117
},
{
"x": 775.1635860807702,
"y": 1504.2166634359928
},
{
"x": 471.2972589326282,
"y": 928.3997205180087
},
{
"x": 776.2728662233018,
"y": 1500.7661299788592
},
{
"x": 473.75048770174067,
"y": 923.5605303080717
},
{
"x": 776.8769471235216,
"y": 1481.994517858372
},
{
"x": 475.37711628533975,
"y": 934.1767553962738
},
{
"x": 784.7504082070948,
"y": 1490.0484573551464
},
{
"x": 776.6981881803845,
"y": 1489.5817121821913
},
{
"x": 473.57826380931385,
"y": 936.3942488301748
},
{
"x": 771.0284305277316,
"y": 1511.7692162391486
},
{
"x": 472.6292295972398,
"y": 927.1881220652776
},
{
"x": 781.2969274909835,
"y": 1502.8696615359142
},
{
"x": 475.8821370605845,
"y": 931.2641217987723
},
{
"x": 469.74825724269255,
"y": 928.0845478847211
},
{
"x": 473.418742613286,
"y": 917.6996672722867
}
]
}
],
"drilldown": {},
"tooltip": {
"enabled": true,
"useHTML": false,
"format": null,
"headerFormat": "",
"pointFormat": "<span style=\"color:{series.color}\">Single</span>: <b>{point.x:.0f}</b><br><span style=\"color:{series.color}\">Multi</span>: <b>{point.y:.0f}</b>",
"footerFormat": "",
"shared": false,
"outside": false,
"valueDecimals": null,
"split": false
},
"annotations": null
},
"hc_type": "chart",
"id": "72751024653712701496867195919039457893"
}
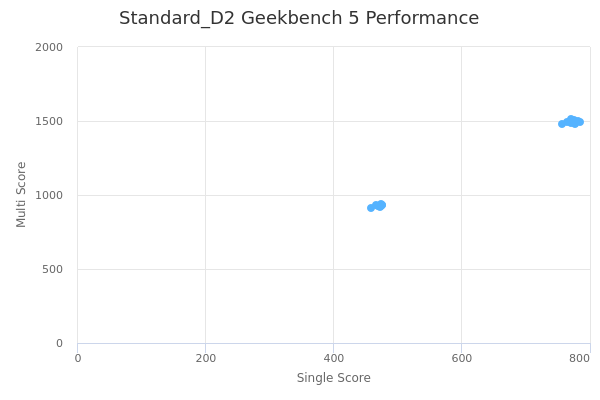
| Single | Multi | |
|---|---|---|
| Max | 785 | 1512 |
| Average | 622 | 1211 |
| Deviation | 151.35 | 283.75 |
| Min | 459 | 913 |
Sign up as Freemium to get more insight.