Standard_A8_v2 by Microsoft Azure
Geekbench is a cross-platform processor benchmark with a scoring system that determines single-core and multi-core performance using loads simulating real-world scenarios. Geekbench 5 score is calculated with a reference score of 2500 representing the performance of the Intel Core i5-2520M @ 2.50 GHz. The software benchmark is available for Mac OS, Windows, Linux, Android and iOS platforms.
Specifications:
CPU
8
RAM
16.0 GB
Extra
1x
80 GB
N/A
{
"configuration": {
"chart": {
"type": "scatter",
"polar": false,
"zoomType": "",
"options3d": {},
"height": null,
"width": null,
"margin": null,
"inverted": false,
"zooming": {}
},
"credits": {
"enabled": false
},
"title": {
"text": ""
},
"colorAxis": null,
"subtitle": {
"text": ""
},
"xAxis": {
"title": {
"text": [
"Single Score"
],
"useHTML": false,
"style": {
"color": "#666666"
}
},
"categories": null,
"lineWidth": 1,
"tickInterval": null,
"tickWidth": 1,
"tickLength": 10,
"tickPixelInterval": 100,
"plotLines": null,
"labels": {
"enabled": true,
"format": null,
"formatter": "",
"style": {
"color": "#666666",
"cursor": "default",
"fontSize": "11px"
},
"useHTML": false,
"step": 0
},
"plotBands": null,
"visible": true,
"floor": null,
"ceiling": null,
"type": "linear",
"min": 0,
"gridLineWidth": 1,
"gridLineColor": "#e6e6e6",
"minorTickInterval": null,
"minorTickWidth": 0,
"minTickInterval": null,
"startOnTick": true,
"endOnTick": true,
"tickmarkPlacement": 100,
"units": 100,
"minRange": 100
},
"yAxis": {
"title": {
"text": [
"Multi Score"
],
"useHTML": false,
"style": {
"color": "#666666"
}
},
"categories": null,
"plotLines": null,
"plotBands": null,
"lineWidth": null,
"tickInterval": null,
"tickLength": 10,
"floor": null,
"ceiling": null,
"gridLineInterpolation": null,
"gridLineWidth": 1,
"gridLineColor": "#e6e6e6",
"min": 0,
"max": null,
"minorTickInterval": null,
"minorTickWidth": 0,
"minTickInterval": null,
"startOnTick": true,
"endOnTick": true,
"minRange": null,
"type": "linear",
"tickmarkPlacement": null,
"labels": {
"enabled": true,
"formatter": null,
"style": {
"color": "#666666",
"cursor": "default",
"fontSize": "11px"
},
"useHTML": false
}
},
"zAxis": {
"title": {
"text": "Multi Score"
}
},
"plotOptions": {
"series": {
"dataLabels": {
"enabled": false,
"format": null,
"distance": 30,
"align": "center",
"inside": null,
"allowOverlap": false,
"style": {
"fontSize": "11px"
}
},
"showInLegend": null,
"turboThreshold": 0,
"stacking": "",
"groupPadding": 0.2,
"centerInCategory": false,
"findNearestPointBy": "x"
}
},
"navigator": {
"enabled": false
},
"scrollbar": {
"enabled": false
},
"rangeSelector": {
"enabled": false,
"inputEnabled": false
},
"legend": {
"enabled": null,
"maxHeight": null,
"align": "center",
"verticalAlign": "bottom",
"layout": "horizontal",
"width": null,
"margin": 12,
"reversed": false
},
"series": [
{
"name": "Standard_A8_v2 by Microsoft Azure",
"color": "#55b3ff",
"data": [
{
"x": 295.3884664577828,
"y": 2226.63086502616
},
{
"x": 293.5802004568932,
"y": 2252.0706236457345
},
{
"x": 295.6201456340085,
"y": 2226.7203917007755
},
{
"x": 293.31590203776034,
"y": 2252.2329767937276
},
{
"x": 294.2135993655539,
"y": 2213.226921282282
},
{
"x": 289.1191892730312,
"y": 2266.81784054796
},
{
"x": 295.72036172681544,
"y": 2211.9517060424073
},
{
"x": 290.16250731789665,
"y": 2265.1318146224307
},
{
"x": 294.0915671188986,
"y": 2198.4698668329606
},
{
"x": 292.06095468650653,
"y": 2269.142426785512
},
{
"x": 293.8968273893904,
"y": 2200.6624869665034
},
{
"x": 292.609485536731,
"y": 2255.8179871559264
},
{
"x": 294.074904493832,
"y": 2206.884373910305
},
{
"x": 292.3896150478349,
"y": 2268.575804237023
},
{
"x": 295.70323850850207,
"y": 2223.0569123049754
},
{
"x": 290.1170810048656,
"y": 2262.6959532328283
},
{
"x": 295.8645230150143,
"y": 2221.9679880930626
},
{
"x": 290.73469682403936,
"y": 2270.837781591261
},
{
"x": 295.5159880600984,
"y": 2214.3865217181183
},
{
"x": 289.8110279937802,
"y": 2266.3777215677464
},
{
"x": 337.9132550700618,
"y": 2297.3958997295263
},
{
"x": 287.63273470985285,
"y": 2134.3165689841508
},
{
"x": 330.402467476367,
"y": 2297.8184549756265
},
{
"x": 281.7174098588371,
"y": 2139.110346515307
},
{
"x": 340.9526797630204,
"y": 2283.998892888393
},
{
"x": 287.66731441256263,
"y": 2152.411746392012
},
{
"x": 332.2531755962253,
"y": 2290.23074590735
},
{
"x": 285.0242538772534,
"y": 2141.4713584026267
},
{
"x": 338.0629802303754,
"y": 2300.1240115321143
},
{
"x": 288.88359617329564,
"y": 2141.885275218131
},
{
"x": 333.0146660429608,
"y": 2290.7897116090994
},
{
"x": 286.03547625868606,
"y": 2136.936861086557
},
{
"x": 336.17562245559577,
"y": 2300.7298586650777
},
{
"x": 286.44364238040095,
"y": 2137.38028047129
},
{
"x": 335.52277274433527,
"y": 2293.4565793374845
},
{
"x": 285.6567447032152,
"y": 2142.5937070502414
},
{
"x": 342.47824172120755,
"y": 2294.917027161443
},
{
"x": 334.8532229861005,
"y": 2260.3690221024676
},
{
"x": 286.46343559695896,
"y": 2095.4694015540485
},
{
"x": 277.20747222559714,
"y": 2105.1080450812747
}
]
}
],
"drilldown": {},
"tooltip": {
"enabled": true,
"useHTML": false,
"format": null,
"headerFormat": "",
"pointFormat": "<span style=\"color:{series.color}\">Single</span>: <b>{point.x:.0f}</b><br><span style=\"color:{series.color}\">Multi</span>: <b>{point.y:.0f}</b>",
"footerFormat": "",
"shared": false,
"outside": false,
"valueDecimals": null,
"split": false
},
"annotations": null
},
"hc_type": "chart",
"id": "287466293884254981024141795991589335564"
}
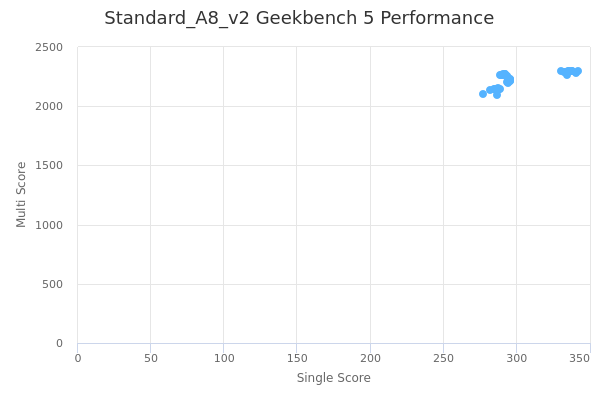
| Single | Multi | |
|---|---|---|
| Max | 342 | 2301 |
| Average | 302 | 2225 |
| Deviation | 20.22 | 61.21 |
| Min | 277 | 2095 |
Sign up as Freemium to get more insight.
- In same series
- Standard_A1_v2
- Standard_A2_v2
- Standard_A4_v2
- Standard_A8_v2