Standard_A4_v2 by Microsoft Azure
Geekbench is a cross-platform processor benchmark with a scoring system that determines single-core and multi-core performance using loads simulating real-world scenarios. Geekbench 5 score is calculated with a reference score of 2500 representing the performance of the Intel Core i5-2520M @ 2.50 GHz. The software benchmark is available for Mac OS, Windows, Linux, Android and iOS platforms.
Specifications:
CPU
4
RAM
8.0 GB
Extra
1x
40 GB
N/A
{
"configuration": {
"chart": {
"type": "scatter",
"polar": false,
"zoomType": "",
"options3d": {},
"height": null,
"width": null,
"margin": null,
"inverted": false,
"zooming": {}
},
"credits": {
"enabled": false
},
"title": {
"text": ""
},
"colorAxis": null,
"subtitle": {
"text": ""
},
"xAxis": {
"title": {
"text": [
"Single Score"
],
"useHTML": false,
"style": {
"color": "#666666"
}
},
"categories": null,
"lineWidth": 1,
"tickInterval": null,
"tickWidth": 1,
"tickLength": 10,
"tickPixelInterval": 100,
"plotLines": null,
"labels": {
"enabled": true,
"format": null,
"formatter": "",
"style": {
"color": "#666666",
"cursor": "default",
"fontSize": "11px"
},
"useHTML": false,
"step": 0
},
"plotBands": null,
"visible": true,
"floor": null,
"ceiling": null,
"type": "linear",
"min": 0,
"gridLineWidth": 1,
"gridLineColor": "#e6e6e6",
"minorTickInterval": null,
"minorTickWidth": 0,
"minTickInterval": null,
"startOnTick": true,
"endOnTick": true,
"tickmarkPlacement": 100,
"units": 100,
"minRange": 100
},
"yAxis": {
"title": {
"text": [
"Multi Score"
],
"useHTML": false,
"style": {
"color": "#666666"
}
},
"categories": null,
"plotLines": null,
"plotBands": null,
"lineWidth": null,
"tickInterval": null,
"tickLength": 10,
"floor": null,
"ceiling": null,
"gridLineInterpolation": null,
"gridLineWidth": 1,
"gridLineColor": "#e6e6e6",
"min": 0,
"max": null,
"minorTickInterval": null,
"minorTickWidth": 0,
"minTickInterval": null,
"startOnTick": true,
"endOnTick": true,
"minRange": null,
"type": "linear",
"tickmarkPlacement": null,
"labels": {
"enabled": true,
"formatter": null,
"style": {
"color": "#666666",
"cursor": "default",
"fontSize": "11px"
},
"useHTML": false
}
},
"zAxis": {
"title": {
"text": "Multi Score"
}
},
"plotOptions": {
"series": {
"dataLabels": {
"enabled": false,
"format": null,
"distance": 30,
"align": "center",
"inside": null,
"allowOverlap": false,
"style": {
"fontSize": "11px"
}
},
"showInLegend": null,
"turboThreshold": 0,
"stacking": "",
"groupPadding": 0.2,
"centerInCategory": false,
"findNearestPointBy": "x"
}
},
"navigator": {
"enabled": false
},
"scrollbar": {
"enabled": false
},
"rangeSelector": {
"enabled": false,
"inputEnabled": false
},
"legend": {
"enabled": null,
"maxHeight": null,
"align": "center",
"verticalAlign": "bottom",
"layout": "horizontal",
"width": null,
"margin": 12,
"reversed": false
},
"series": [
{
"name": "Standard_A4_v2 by Microsoft Azure",
"color": "#55b3ff",
"data": [
{
"x": 288.14268576943635,
"y": 1142.7465019700749
},
{
"x": 271.7323647055214,
"y": 1056.7131394713888
},
{
"x": 288.3159586582432,
"y": 1144.6728336229341
},
{
"x": 272.66804665672475,
"y": 1057.779347002444
},
{
"x": 292.4805690998017,
"y": 1147.2341731241438
},
{
"x": 273.25604426489895,
"y": 1057.0073590548434
},
{
"x": 291.3313676260437,
"y": 1147.23165014376
},
{
"x": 274.0385816612598,
"y": 1053.87856897937
},
{
"x": 291.216539840498,
"y": 1136.2746726794824
},
{
"x": 273.8567102940556,
"y": 1054.940447629627
},
{
"x": 289.51271737225227,
"y": 1142.7326749207255
},
{
"x": 273.2725152715599,
"y": 1055.4914500871923
},
{
"x": 286.4669025653202,
"y": 1145.2655893196827
},
{
"x": 274.0177883404188,
"y": 1059.3441876644488
},
{
"x": 288.26029582520385,
"y": 1147.5314771467838
},
{
"x": 271.69918488515924,
"y": 1058.2261288816458
},
{
"x": 287.1232152308453,
"y": 1147.356945568483
},
{
"x": 272.12932334690515,
"y": 1062.4216193206275
},
{
"x": 288.32829130349023,
"y": 1146.1905509340345
},
{
"x": 272.3076660843025,
"y": 1057.8145779144306
},
{
"x": 271.5859558338273,
"y": 1101.3355656283234
},
{
"x": 274.75100507974173,
"y": 1073.8244206375211
},
{
"x": 273.120436074229,
"y": 1075.4758119054648
},
{
"x": 262.1530785777978,
"y": 1022.6540019098951
},
{
"x": 271.1593234008751,
"y": 1089.4386457329326
},
{
"x": 270.5391539131466,
"y": 1043.0682557450973
}
]
}
],
"drilldown": {},
"tooltip": {
"enabled": true,
"useHTML": false,
"format": null,
"headerFormat": "",
"pointFormat": "<span style=\"color:{series.color}\">Single</span>: <b>{point.x:.0f}</b><br><span style=\"color:{series.color}\">Multi</span>: <b>{point.y:.0f}</b>",
"footerFormat": "",
"shared": false,
"outside": false,
"valueDecimals": null,
"split": false
},
"annotations": null
},
"hc_type": "chart",
"id": "120631499848808851088462421049761966866"
}
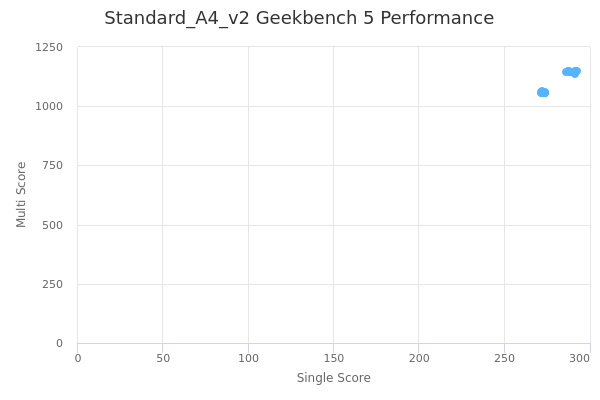
| Single | Multi | |
|---|---|---|
| Max | 292 | 1148 |
| Average | 279 | 1093 |
| Deviation | 8.68 | 42.88 |
| Min | 262 | 1023 |
Sign up as Freemium to get more insight.
- In same series
- Standard_A1_v2
- Standard_A2_v2
- Standard_A4_v2
- Standard_A8_v2