t3a.xlarge by Amazon Web Services
Geekbench is a cross-platform processor benchmark with a scoring system that determines single-core and multi-core performance using loads simulating real-world scenarios. Geekbench 5 score is calculated with a reference score of 2500 representing the performance of the Intel Core i5-2520M @ 2.50 GHz. The software benchmark is available for Mac OS, Windows, Linux, Android and iOS platforms.
Specifications:
CPU
4
RAM
16.0 GB
Net
5000 Mbps
{
"configuration": {
"chart": {
"type": "scatter",
"polar": false,
"zoomType": "",
"options3d": {},
"height": null,
"width": null,
"margin": null,
"inverted": false,
"zooming": {}
},
"credits": {
"enabled": false
},
"title": {
"text": ""
},
"colorAxis": null,
"subtitle": {
"text": ""
},
"xAxis": {
"title": {
"text": [
"Single Score"
],
"useHTML": false,
"style": {
"color": "#666666"
}
},
"categories": null,
"lineWidth": 1,
"tickInterval": null,
"tickWidth": 1,
"tickLength": 10,
"tickPixelInterval": 100,
"plotLines": null,
"labels": {
"enabled": true,
"format": null,
"formatter": "",
"style": {
"color": "#666666",
"cursor": "default",
"fontSize": "11px"
},
"useHTML": false,
"step": 0
},
"plotBands": null,
"visible": true,
"floor": null,
"ceiling": null,
"type": "linear",
"min": 0,
"gridLineWidth": 1,
"gridLineColor": "#e6e6e6",
"minorTickInterval": null,
"minorTickWidth": 0,
"minTickInterval": null,
"startOnTick": true,
"endOnTick": true,
"tickmarkPlacement": 100,
"units": 100,
"minRange": 100
},
"yAxis": {
"title": {
"text": [
"Multi Score"
],
"useHTML": false,
"style": {
"color": "#666666"
}
},
"categories": null,
"plotLines": null,
"plotBands": null,
"lineWidth": null,
"tickInterval": null,
"tickLength": 10,
"floor": null,
"ceiling": null,
"gridLineInterpolation": null,
"gridLineWidth": 1,
"gridLineColor": "#e6e6e6",
"min": 0,
"max": null,
"minorTickInterval": null,
"minorTickWidth": 0,
"minTickInterval": null,
"startOnTick": true,
"endOnTick": true,
"minRange": null,
"type": "linear",
"tickmarkPlacement": null,
"labels": {
"enabled": true,
"formatter": null,
"style": {
"color": "#666666",
"cursor": "default",
"fontSize": "11px"
},
"useHTML": false
}
},
"zAxis": {
"title": {
"text": "Multi Score"
}
},
"plotOptions": {
"series": {
"dataLabels": {
"enabled": false,
"format": null,
"distance": 30,
"align": "center",
"inside": null,
"allowOverlap": false,
"style": {
"fontSize": "11px"
}
},
"showInLegend": null,
"turboThreshold": 0,
"stacking": "",
"groupPadding": 0.2,
"centerInCategory": false,
"findNearestPointBy": "x"
}
},
"navigator": {
"enabled": false
},
"scrollbar": {
"enabled": false
},
"rangeSelector": {
"enabled": false,
"inputEnabled": false
},
"legend": {
"enabled": null,
"maxHeight": null,
"align": "center",
"verticalAlign": "bottom",
"layout": "horizontal",
"width": null,
"margin": 12,
"reversed": false
},
"series": [
{
"name": "t3a.xlarge by Amazon Web Services",
"color": "#f7981d",
"data": [
{
"x": 627.7044071961514,
"y": 1612.0999445192692
},
{
"x": 644.3851431757148,
"y": 1643.069224954937
},
{
"x": 656.3457000780636,
"y": 1619.8422380182399
},
{
"x": 618.4702728379891,
"y": 1660.0927665798035
},
{
"x": 664.9875703071114,
"y": 1627.6591844697537
},
{
"x": 638.2305956831965,
"y": 1639.1595897911643
},
{
"x": 647.4787676304096,
"y": 1656.162398264084
},
{
"x": 640.6174312249053,
"y": 1607.4580907555642
},
{
"x": 646.9029679259783,
"y": 1654.6671239199277
},
{
"x": 652.9567281445288,
"y": 1642.1002418924245
},
{
"x": 693.9139139438511,
"y": 1735.2797855627964
},
{
"x": 686.5005688336764,
"y": 1684.5288915632866
},
{
"x": 697.4034934293991,
"y": 1717.1556523220431
},
{
"x": 678.559030281808,
"y": 1709.2017138201759
},
{
"x": 695.0785466049614,
"y": 1742.8484971876187
},
{
"x": 675.6724343575909,
"y": 1667.4247763562178
},
{
"x": 691.7101400010486,
"y": 1721.954766254399
},
{
"x": 677.2272180967424,
"y": 1707.9181345840134
},
{
"x": 695.0921678310299,
"y": 1738.585263078698
},
{
"x": 684.0361817077874,
"y": 1667.5740387299343
},
{
"x": 690.6113626946008,
"y": 1719.4681997726575
},
{
"x": 665.4152896438475,
"y": 1696.2538604091328
},
{
"x": 691.2107647066749,
"y": 1713.1610545230149
},
{
"x": 673.960914850238,
"y": 1693.048253699963
},
{
"x": 697.6443147631057,
"y": 1730.876190317498
},
{
"x": 683.7128504941637,
"y": 1701.6623759125891
},
{
"x": 695.8281669287338,
"y": 1718.6035350777192
},
{
"x": 691.5786915680098,
"y": 1699.7645141745481
},
{
"x": 698.5707482385344,
"y": 1745.9447392091724
},
{
"x": 674.7033481236376,
"y": 1680.0183260693275
}
]
}
],
"drilldown": {},
"tooltip": {
"enabled": true,
"useHTML": false,
"format": null,
"headerFormat": "",
"pointFormat": "<span style=\"color:{series.color}\">Single</span>: <b>{point.x:.0f}</b><br><span style=\"color:{series.color}\">Multi</span>: <b>{point.y:.0f}</b>",
"footerFormat": "",
"shared": false,
"outside": false,
"valueDecimals": null,
"split": false
},
"annotations": null
},
"hc_type": "chart",
"id": "338070306520919452876592781433144627364"
}
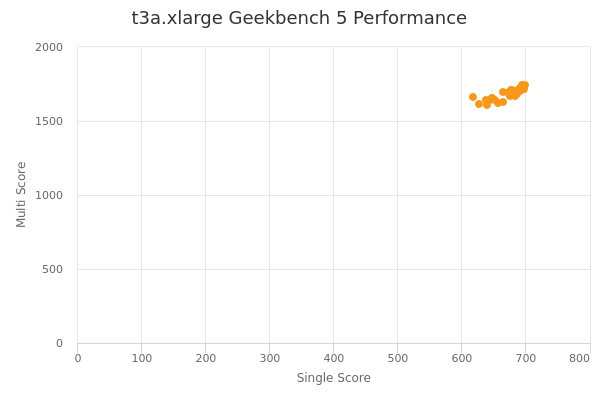
| Single | Multi | |
|---|---|---|
| Max | 699 | 1746 |
| Average | 673 | 1685 |
| Deviation | 22.97 | 40.60 |
| Min | 618 | 1607 |
Sign up as Freemium to get more insight.
- In same series
- t3a.nano
- t3a.micro
- t3a.small
- t3a.medium
- t3a.large
- t3a.xlarge
- t3a.2xlarge