r5ad.8xlarge by Amazon Web Services
Geekbench is a cross-platform processor benchmark with a scoring system that determines single-core and multi-core performance using loads simulating real-world scenarios. Geekbench 5 score is calculated with a reference score of 2500 representing the performance of the Intel Core i5-2520M @ 2.50 GHz. The software benchmark is available for Mac OS, Windows, Linux, Android and iOS platforms.
Specifications:
CPU
32
RAM
256.0 GB
Extra
2x
600 GB
NVMe SSD
Net
10000 Mbps
{
"configuration": {
"chart": {
"type": "scatter",
"polar": false,
"zoomType": "",
"options3d": {},
"height": null,
"width": null,
"margin": null,
"inverted": false,
"zooming": {}
},
"credits": {
"enabled": false
},
"title": {
"text": ""
},
"colorAxis": null,
"subtitle": {
"text": ""
},
"xAxis": {
"title": {
"text": [
"Single Score"
],
"useHTML": false,
"style": {
"color": "#666666"
}
},
"categories": null,
"lineWidth": 1,
"tickInterval": null,
"tickWidth": 1,
"tickLength": 10,
"tickPixelInterval": 100,
"plotLines": null,
"labels": {
"enabled": true,
"format": null,
"formatter": "",
"style": {
"color": "#666666",
"cursor": "default",
"fontSize": "11px"
},
"useHTML": false,
"step": 0
},
"plotBands": null,
"visible": true,
"floor": null,
"ceiling": null,
"type": "linear",
"min": 0,
"gridLineWidth": 1,
"gridLineColor": "#e6e6e6",
"minorTickInterval": null,
"minorTickWidth": 0,
"minTickInterval": null,
"startOnTick": true,
"endOnTick": true,
"tickmarkPlacement": 100,
"units": 100,
"minRange": 100
},
"yAxis": {
"title": {
"text": [
"Multi Score"
],
"useHTML": false,
"style": {
"color": "#666666"
}
},
"categories": null,
"plotLines": null,
"plotBands": null,
"lineWidth": null,
"tickInterval": null,
"tickLength": 10,
"floor": null,
"ceiling": null,
"gridLineInterpolation": null,
"gridLineWidth": 1,
"gridLineColor": "#e6e6e6",
"min": 0,
"max": null,
"minorTickInterval": null,
"minorTickWidth": 0,
"minTickInterval": null,
"startOnTick": true,
"endOnTick": true,
"minRange": null,
"type": "linear",
"tickmarkPlacement": null,
"labels": {
"enabled": true,
"formatter": null,
"style": {
"color": "#666666",
"cursor": "default",
"fontSize": "11px"
},
"useHTML": false
}
},
"zAxis": {
"title": {
"text": "Multi Score"
}
},
"plotOptions": {
"series": {
"dataLabels": {
"enabled": false,
"format": null,
"distance": 30,
"align": "center",
"inside": null,
"allowOverlap": false,
"style": {
"fontSize": "11px"
}
},
"showInLegend": null,
"turboThreshold": 0,
"stacking": "",
"groupPadding": 0.2,
"centerInCategory": false,
"findNearestPointBy": "x"
}
},
"navigator": {
"enabled": false
},
"scrollbar": {
"enabled": false
},
"rangeSelector": {
"enabled": false,
"inputEnabled": false
},
"legend": {
"enabled": null,
"maxHeight": null,
"align": "center",
"verticalAlign": "bottom",
"layout": "horizontal",
"width": null,
"margin": 12,
"reversed": false
},
"series": [
{
"name": "r5ad.8xlarge by Amazon Web Services",
"color": "#f7981d",
"data": [
{
"x": 629.8760893774006,
"y": 9442.141381006773
},
{
"x": 632.4070874503321,
"y": 9341.79959748741
},
{
"x": 631.6086385569292,
"y": 9235.202340427397
},
{
"x": 626.9380887775658,
"y": 9264.734423076985
},
{
"x": 629.6209839742701,
"y": 9225.574337680098
},
{
"x": 627.2231728647785,
"y": 9178.25234245243
},
{
"x": 632.6120199823624,
"y": 9433.507099833194
},
{
"x": 628.7061020325564,
"y": 9383.643110967967
},
{
"x": 631.9370545542214,
"y": 9395.53631193255
},
{
"x": 627.1179192699402,
"y": 9495.57886245354
},
{
"x": 631.8337037269196,
"y": 9449.900857591649
},
{
"x": 627.7742655836316,
"y": 9342.85058170971
},
{
"x": 631.7972761483688,
"y": 9360.885760941237
},
{
"x": 627.8568078786639,
"y": 9384.233971424808
},
{
"x": 631.6358221998553,
"y": 9382.926192571582
},
{
"x": 627.0334515618285,
"y": 9321.53866791824
},
{
"x": 630.188242978245,
"y": 9363.632251926767
},
{
"x": 627.3799259077327,
"y": 9275.578649254943
},
{
"x": 630.2005590067683,
"y": 9236.995622483517
},
{
"x": 628.5312728442434,
"y": 9214.19232342154
}
]
}
],
"drilldown": {},
"tooltip": {
"enabled": true,
"useHTML": false,
"format": null,
"headerFormat": "",
"pointFormat": "<span style=\"color:{series.color}\">Single</span>: <b>{point.x:.0f}</b><br><span style=\"color:{series.color}\">Multi</span>: <b>{point.y:.0f}</b>",
"footerFormat": "",
"shared": false,
"outside": false,
"valueDecimals": null,
"split": false
},
"annotations": null
},
"hc_type": "chart",
"id": "63536845932166896392569705172846551415"
}
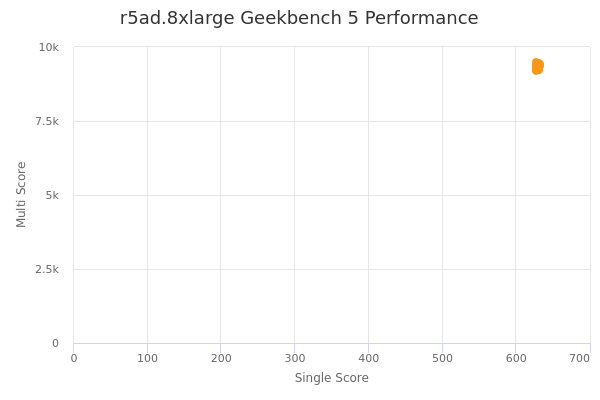
| Single | Multi | |
|---|---|---|
| Max | 633 | 9496 |
| Average | 630 | 9336 |
| Deviation | 2.00 | 87.13 |
| Min | 627 | 9178 |
Sign up as Freemium to get more insight.