r5ad.2xlarge by Amazon Web Services
Geekbench is a cross-platform processor benchmark with a scoring system that determines single-core and multi-core performance using loads simulating real-world scenarios. Geekbench 5 score is calculated with a reference score of 2500 representing the performance of the Intel Core i5-2520M @ 2.50 GHz. The software benchmark is available for Mac OS, Windows, Linux, Android and iOS platforms.
Specifications:
CPU
8
RAM
64.0 GB
Extra
1x
300 GB
NVMe SSD
Net
10000 Mbps
{
"configuration": {
"chart": {
"type": "scatter",
"polar": false,
"zoomType": "",
"options3d": {},
"height": null,
"width": null,
"margin": null,
"inverted": false,
"zooming": {}
},
"credits": {
"enabled": false
},
"title": {
"text": ""
},
"colorAxis": null,
"subtitle": {
"text": ""
},
"xAxis": {
"title": {
"text": [
"Single Score"
],
"useHTML": false,
"style": {
"color": "#666666"
}
},
"categories": null,
"lineWidth": 1,
"tickInterval": null,
"tickWidth": 1,
"tickLength": 10,
"tickPixelInterval": 100,
"plotLines": null,
"labels": {
"enabled": true,
"format": null,
"formatter": "",
"style": {
"color": "#666666",
"cursor": "default",
"fontSize": "11px"
},
"useHTML": false,
"step": 0
},
"plotBands": null,
"visible": true,
"floor": null,
"ceiling": null,
"type": "linear",
"min": 0,
"gridLineWidth": 1,
"gridLineColor": "#e6e6e6",
"minorTickInterval": null,
"minorTickWidth": 0,
"minTickInterval": null,
"startOnTick": true,
"endOnTick": true,
"tickmarkPlacement": 100,
"units": 100,
"minRange": 100
},
"yAxis": {
"title": {
"text": [
"Multi Score"
],
"useHTML": false,
"style": {
"color": "#666666"
}
},
"categories": null,
"plotLines": null,
"plotBands": null,
"lineWidth": null,
"tickInterval": null,
"tickLength": 10,
"floor": null,
"ceiling": null,
"gridLineInterpolation": null,
"gridLineWidth": 1,
"gridLineColor": "#e6e6e6",
"min": 0,
"max": null,
"minorTickInterval": null,
"minorTickWidth": 0,
"minTickInterval": null,
"startOnTick": true,
"endOnTick": true,
"minRange": null,
"type": "linear",
"tickmarkPlacement": null,
"labels": {
"enabled": true,
"formatter": null,
"style": {
"color": "#666666",
"cursor": "default",
"fontSize": "11px"
},
"useHTML": false
}
},
"zAxis": {
"title": {
"text": "Multi Score"
}
},
"plotOptions": {
"series": {
"dataLabels": {
"enabled": false,
"format": null,
"distance": 30,
"align": "center",
"inside": null,
"allowOverlap": false,
"style": {
"fontSize": "11px"
}
},
"showInLegend": null,
"turboThreshold": 0,
"stacking": "",
"groupPadding": 0.2,
"centerInCategory": false,
"findNearestPointBy": "x"
}
},
"navigator": {
"enabled": false
},
"scrollbar": {
"enabled": false
},
"rangeSelector": {
"enabled": false,
"inputEnabled": false
},
"legend": {
"enabled": null,
"maxHeight": null,
"align": "center",
"verticalAlign": "bottom",
"layout": "horizontal",
"width": null,
"margin": 12,
"reversed": false
},
"series": [
{
"name": "r5ad.2xlarge by Amazon Web Services",
"color": "#f7981d",
"data": [
{
"x": 717.0524247336721,
"y": 3184.7242649570076
},
{
"x": 713.0168371664739,
"y": 3170.963973984709
},
{
"x": 714.508039983214,
"y": 3171.166108604234
},
{
"x": 718.0461455305717,
"y": 3161.4662818791103
},
{
"x": 721.8857163478319,
"y": 3167.205655945363
},
{
"x": 709.897702764911,
"y": 3148.707987732638
},
{
"x": 715.1322911360286,
"y": 3191.2222433710813
},
{
"x": 708.6897298511004,
"y": 3164.6853252309606
},
{
"x": 717.4029312990862,
"y": 3192.7785068772864
},
{
"x": 710.7949452227713,
"y": 3160.264726315454
},
{
"x": 714.9942851101623,
"y": 3163.145161653194
},
{
"x": 709.0560444654716,
"y": 3148.4682334875924
},
{
"x": 714.749716203451,
"y": 3180.879538486942
},
{
"x": 711.7335153003643,
"y": 3181.555061820606
},
{
"x": 716.8290319375652,
"y": 3188.3972763459656
},
{
"x": 711.3754441618644,
"y": 3177.215706377103
},
{
"x": 713.6227242489603,
"y": 3189.832576071951
},
{
"x": 707.4954499187327,
"y": 3185.6135195386437
},
{
"x": 717.942322811444,
"y": 3176.7917067058665
},
{
"x": 710.8163840024242,
"y": 3177.795575701724
}
]
}
],
"drilldown": {},
"tooltip": {
"enabled": true,
"useHTML": false,
"format": null,
"headerFormat": "",
"pointFormat": "<span style=\"color:{series.color}\">Single</span>: <b>{point.x:.0f}</b><br><span style=\"color:{series.color}\">Multi</span>: <b>{point.y:.0f}</b>",
"footerFormat": "",
"shared": false,
"outside": false,
"valueDecimals": null,
"split": false
},
"annotations": null
},
"hc_type": "chart",
"id": "133502130158118625534439340655953957013"
}
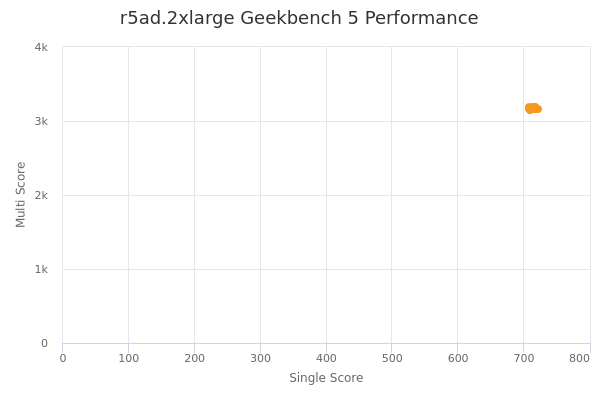
| Single | Multi | |
|---|---|---|
| Max | 722 | 3193 |
| Average | 714 | 3174 |
| Deviation | 3.68 | 13.04 |
| Min | 707 | 3148 |
Sign up as Freemium to get more insight.